Money Digital Music Group - it's MGMT team in music industry, who provide HQ service of complete management your @SoundClick , @BeatStars , @BBrokerz etc.
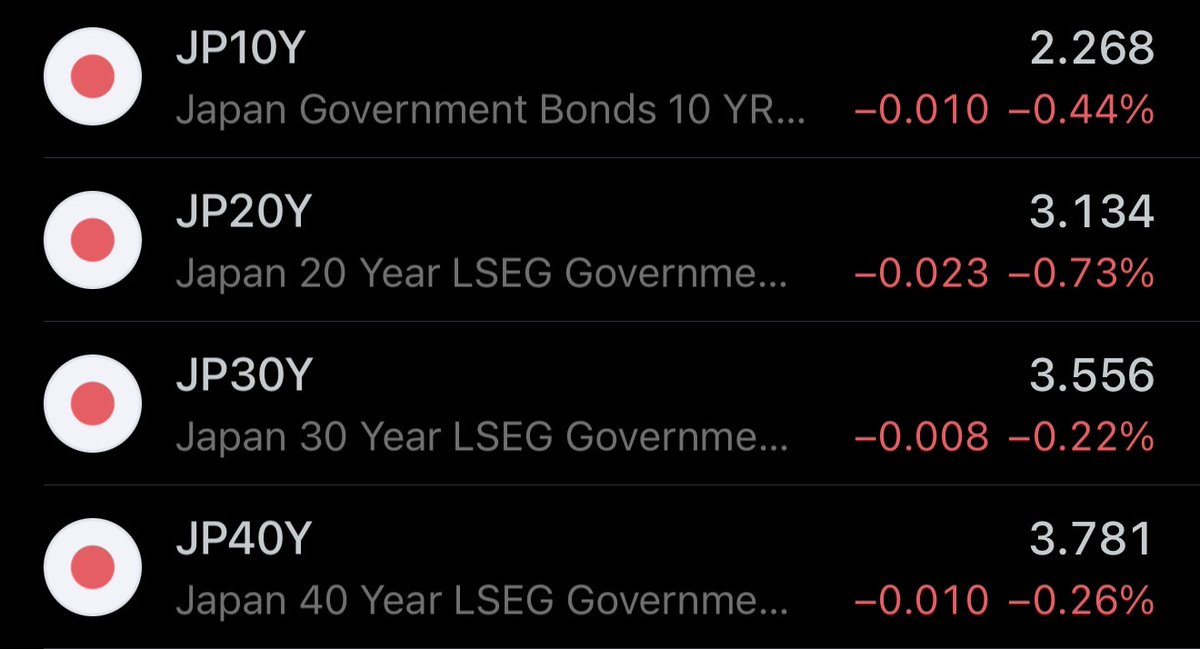
🚨 THIS IS VERY BAD!
Japan 10Y down
Japan 20Y down
Japan 30Y down
Japan 40Y down
Nobody is talking about this, but they should.
If you have money in the market, this matters.
For 20+ years, Japan was the funding engine of the world.
Zero rates.
Cheap yen.
Capital borrowed and deployed globally into:
- U.S. equities
- Crypto
- Real estate
When JGB yields move like this across the curve, it’s not bullish.
Capital is shifting.
Japanese institutions are among the largest holders of foreign assets.
When yields move, they rotate back home.
Less money flows abroad.
Liquidity tightens.
Quietly.
We’ve seen this before.
When positioning is crowded and volatility rises, capital moves fast.
It goes to the deepest market.
That market is JGBs.
Right now, risk is being reduced.
Before it shows up everywhere else.
That’s how liquidity disappears.
Risk assets feel it first.
Watch the 10Y.
When this accelerates, things start breaking.
I’ve been in the markets for more than 15 years.
When I make my next move, I’ll share it here publicly.
If you’re not following yet, you’ll understand why that was a mistake.
🚨 WARNING: THE COUNTDOWN TO A TOTAL COLLAPSE HAS BEGUN
Global tensions are escalating, and markets are beginning to price in the risk of a wider conflict.
Behind the scenes, panic is building.
Not because politicians suddenly care.
Because they know the system is dying.
For years, the strategy was simple:
- Kick the problem forward.
- Print money.
- Tell the public everything is fine.
But that playbook is starting to break.
And the signals are getting harder to hide.
Look at what’s happening under the surface.
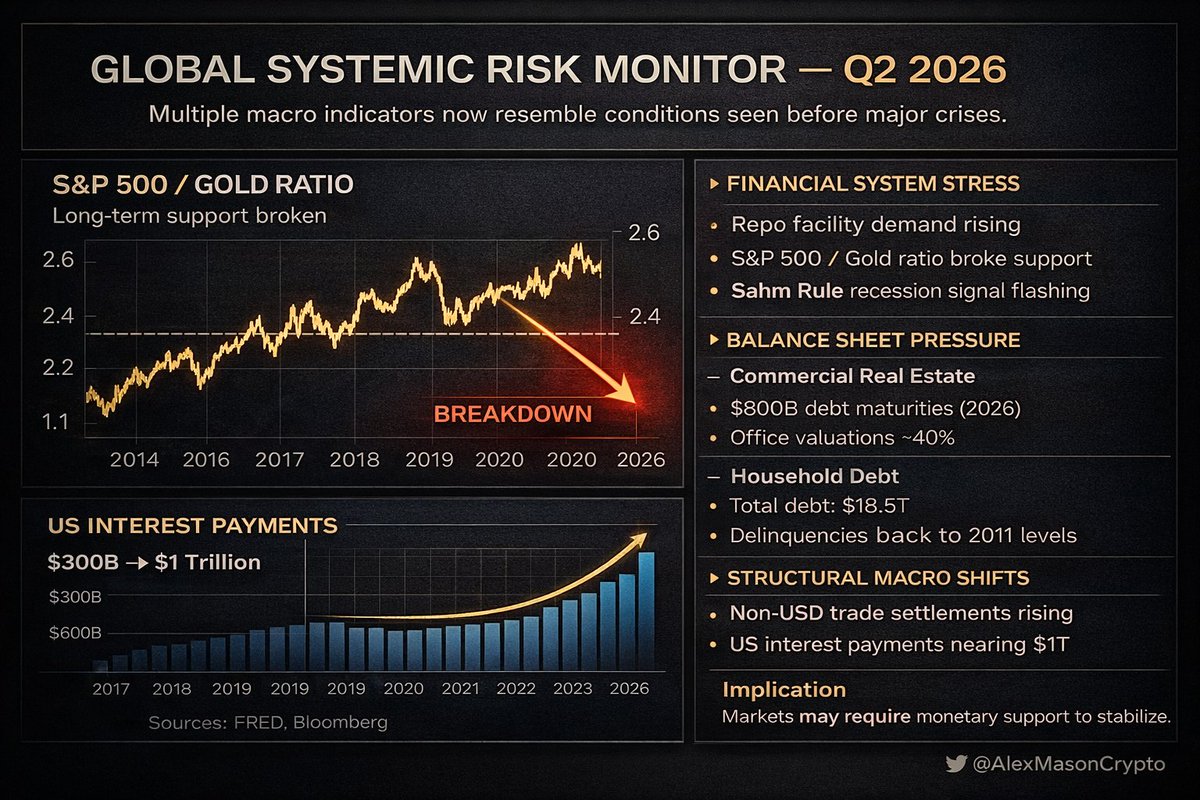
1. Funding stress ATH
The Fed’s emergency repo facility just saw a major spike in demand.
Private lenders are becoming reluctant to lend to each other.
This is the same pattern we saw in the weeks before Lehman collapsed.
2. Market signals are flashing red
The S&P 500 / Gold ratio just broke a key long-term support level.
The last time that happened?
Right before the 2008 financial crisis.
3. The real estate time bomb
More than $800B in commercial real estate debt matures this year.
Office buildings across major cities are worth 30–40% less than the loans sitting on bank balance sheets.
Refinancing at today’s interest rates is almost impossible.
Banks already know this.
That’s why many of these loans are quietly being sold off behind the scenes.
4. Consumers are in debt
Credit card delinquencies (90+ days past due) are climbing toward levels last seen after the Global Financial Crisis.
Auto loan delinquencies are surging.
Household debt is approaching $19 trillion.
5. The dollar’s global dominance is slowly eroding
Trade between Russia, China, and India is increasingly settled outside the USD.
It’s not the end of the dollar.
But the trend is moving in one direction.
And trends matter.
Now combine all of this with one final problem:
The U.S. government is approaching $1 trillion per year in interest payments alone.
That’s before defense.
Before healthcare.
Before anything else.
This is the corner policymakers are now trapped in.
Higher rates break the system.
Lower rates weaken the currency.
There is no easy path out.
Moments like this are exactly when the largest wealth transfers happen.
I’ve been in the markets for more than 15 years.
When I make my next major move, I’ll share it here publicly like I always do.
A lot of people will wish they were following me sooner.
🚨 WATCH OUT TOMORROW
There is a reason Bessent was pulled into an emergency meeting today.
Meetings like that don’t happen when the system is healthy.
Right now the pressure is coming from private credit.
Over the last decade, private credit exploded from roughly $600 billion to more than $1.7 trillion.
Cheap money flooded the system.
Funds lent massive amounts to companies that traditional banks refused to finance.
It worked perfectly when liquidity was endless and interest rates were near zero.
But that environment is gone.
Rates are higher.
Liquidity is tighter.
And now investors are starting to ask for their money back.
Redemptions are rising.
When that happens, funds don’t have many options.
They sell assets.
Fast.
That’s exactly how forced liquidation cycles begin.
We’ve seen this movie before.
In 2008, the cracks first appeared in subprime credit.
In 2019, the repo market suddenly froze and funding rates spiked to nearly 10% overnight.
In March 2020, even U.S. Treasuries briefly stopped trading properly.
Every major market shock starts the same way.
Liquidity disappears.
Then selling accelerates.
That’s why the Fed is now reportedly discussing a 50 basis point rate cut.
Not because inflation vanished.
Because something in the system may be starting to break.
The next signal to watch is consumer credit.
Credit card delinquencies are already rising toward levels last seen during the Global Financial Crisis.
When households begin missing payments, stress moves directly into the banking system.
At the same time, geopolitical risks remain elevated going into the weekend.
Markets hate uncertainty.
When tight liquidity, rising credit stress, and geopolitical risk collide, things can move very quickly.
Protect your capital.
I’ve been in finance for more than 15 years.
When I EXIT the markets completely, I’ll say it here publicly, like I always do.
Many people will wish they followed sooner.
If you’re over 18, the next 6–12 months will be the most important of your life.
Very few people understand what is going on right now.
We are entering the largest wealth transfer in history.
Most people think the worst is already behind us.
THIS IS WRONG.
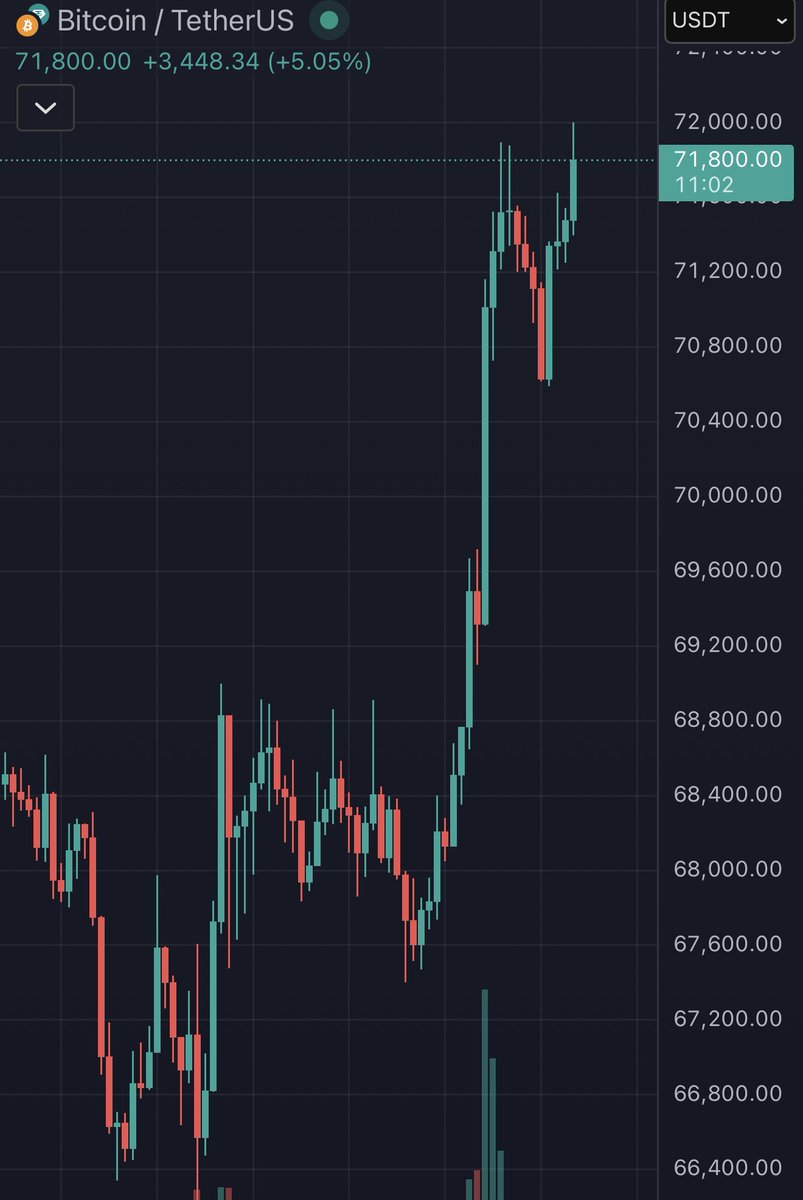
The S&P is trading at the most overvalued level in history.
Bitcoin hasn’t bottomed yet.
We will see one last aggressive flush before the next cycle begins.
If you’re dollar-cost averaging right now, that’s not a mistake.
Bitcoin remains the most asymmetrically priced asset in the market today.
Slow accumulation is a rational way to manage risk.
But do not deploy everything too early.
You need to keep real capital in reserve.
Because when BTC drops below $60,000 and holds there, I’ll be buying consistently.
Systematically.
That kind of dislocation would create the type of opportunity generations wait years for.
The final capitulation phase is where generational wealth is made.
Preparation matters more than prediction.
Stack cash.
Protect liquidity.
Keep your dry powder ready.
Moments like this do not appear often.
And if you’re seeing this now, you’re not late.
You’re early in the accumulation phase.
When the market reaches maximum pessimism, that’s where the real opportunities appear.
It’s the same algorithm that allowed me to buy the major bottoms and exit at the tops over the last decade.
When the real Bitcoin bottom arrives and I deploy 90% of my capital into it, I’ll share it here publicly.
A lot of people will regret not following me.
🚨 THIS IS NOT NORMAL
In the last 24 hours:
Nasdaq: -152.85
Dow Jones: -119.38
S&P 500: -40.41
Trillions of dollars in losses.
We are getting dangerously close to an extreme statistical event.
Something that has NEVER happened in the history.
Think about how insane that is.
In hours, more wealth vanished than the entire GDP of over half the countries on Earth.
We have officially entered the FORCED LIQUIDATION PHASE.
This is what a liquidity black hole looks like.
Funds are being margin-called across the board.
They’re dumping the only assets that still hold value just to survive.
Do not hand them your wealth.
I’ve been in finance for more than 15 years.
When I EXIT the markets completely, I’ll say it here publicly, like I always do.
Many people will wish they followed sooner.
🚨 THIS IS NOT NORMAL
Insiders are selling stocks at the record level since 2021.
At the same time, retail investors are buying shares at levels we have NEVER SEEN BEFORE in history.
Last month, the insider sell-to-buy ratio hit 4.83.
Executives sold almost 5 shares for every 1 they purchased.
That is the most extreme reading in five years.
Look at who is selling:
– The CEO of Johnson & Johnson dumped 100,000 shares.
– The CEO of Royal Caribbean sold 94,000 shares.
– Executives across Amazon, Hasbro, and DraftKings have also been cashing out.
These are the people running the companies.
And many of them are quietly heading for the exit.
Meanwhile, positioning data tells the same story on the institutional side.
According to Goldman Sachs, hedge fund short-selling at the single-stock level just reached an all-time record in early February.
Short trades outnumbered long buys 2 to 1.
In just one week, institutions pulled $8.3 billion out of U.S. equities.
So step back and look at the full picture.
The people with the best information are selling.
The public is buying everything being sold to them.
That type of setup has only appeared a handful of times in the past decade.
Remember, I’ve been in finance for more than 15 years.
When I EXIT the markets completely, I’ll say it here publicly, like I always do.
Many people will wish they followed me sooner.
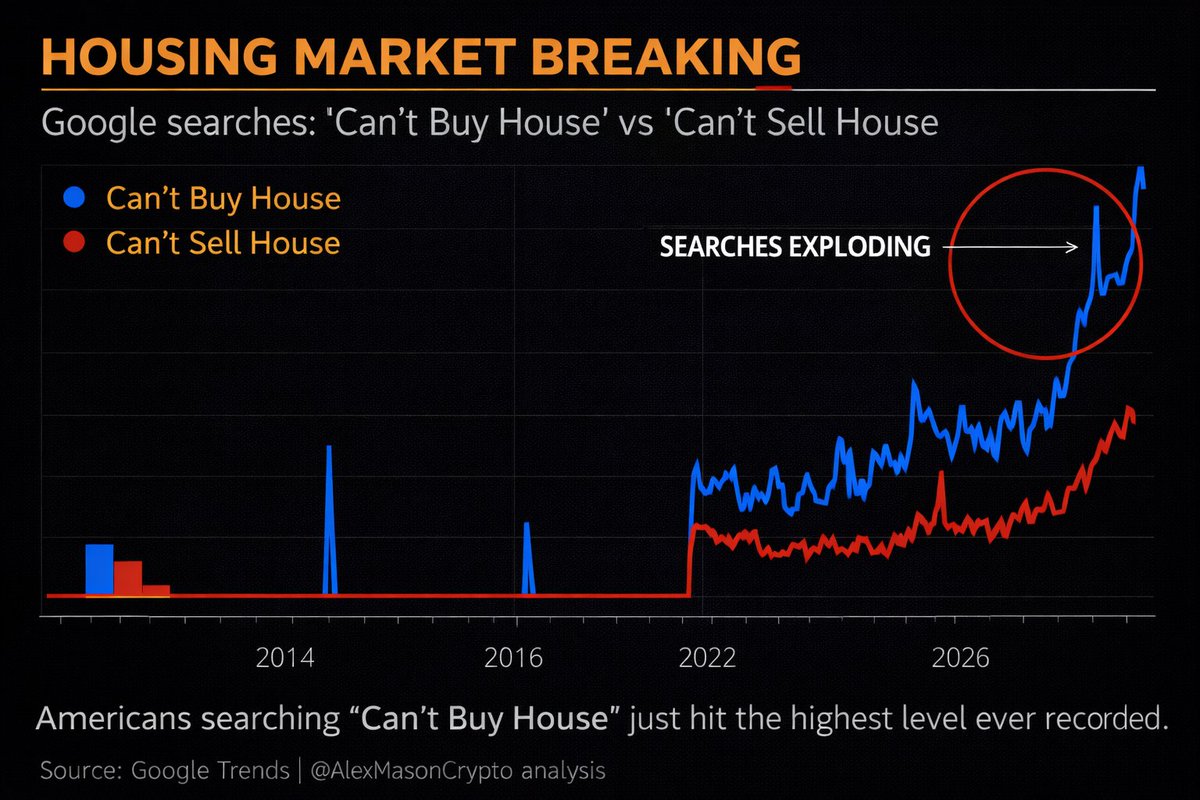
🚨 THIS SHOULD NOT BE HAPPENING
Google searches for “can’t sell house” just hit an ALL-TIME HIGH.
Higher than 2008.
Higher than COVID.
Higher than any point since Google started tracking the data.
This signal usually appears before housing markets break:
When homes stop selling, sellers panic.
They start cutting prices.
They start asking questions.
And the first place they go is Google.
That’s what this data is capturing.
People realizing their house is not moving.
Now look at the macro backdrop.
Mortgage rates were 2.7% in 2021.
Today they’re around 6.5%.
That alone nearly doubled the monthly payment for the same house.
At the same time, prices never corrected.
The median U.S. home is still around $415,000.
Affordability is now the worst it has ever been recorded.
Buyers can’t buy. Sellers don’t want to cut.
Transactions freeze.
And when housing liquidity freezes, pressure builds under the surface.
We saw this movie before.
In 2006, homes stopped selling long before prices collapsed.
By the time the headlines arrived in 2008, the damage was already done.
This data suggests we may be entering that stage.
I’ve been in macro for 15 years and predicted all the market tops and bottoms for the last 15 years.
When I EXIT the markets completely, I’ll say it here publicly, like I always do.
From now on, I’ll share my moves publicly. If you want to win big, follow and turn notifications on.
Many people will wish they followed me sooner.
🚨 THIS IS YOUR WARNING
I just had a private meeting with three UHNW investors.
The situation is significantly worse than I expected.
They’re quietly unloading public equity exposure to cover margin calls and losses sitting inside their private portfolios.
In their words, the cycle has already turned.
We spent most of the discussion on valuations.
And the conclusion was simple.
A large portion of the “wealth” people see on paper doesn’t actually exist.
Here’s how the game works:
Start a company.
Issue 1 billion shares.
Raise a $10M seed round at $1 per share.
Just like that, the company suddenly shows a $1B valuation.
Nothing fundamental changed. But on paper, a billion dollars just appeared.
That inflated valuation can then be used as collateral.
More leverage. More borrowing. More spending power.
Paper valuations become real liquidity.
Most investors think inflation only comes from central banks.
That’s not the full story.
Private markets have been manufacturing collateral for years.
And now the system has to settle the bill.
Over the next 12 to 24 months, trillions in corporate debt will need refinancing.
Much of it was issued when money was essentially free.
Now those same loans are rolling over at 5% to 8% interest.
That shift alone changes everything.
But the valuation side is even more extreme.
Look at the Buffett Indicator.
Market cap relative to GDP.
Dot-com peak in 2000: ~159%
Before the financial crisis in 2008: ~110%
Today: approaching 200%
Higher than any period in modern market history.
At the same time, household equity exposure is sitting near 48%.
That’s also a record.
Which creates a simple problem.
If everyone is already fully invested… who’s left to buy?
I know this sounds uncomfortable.
But markets move in cycles, and cycles eventually reset.
Keep in mind, I’ve called every major market top and bottom over the past 15 years.
When I make my next move, I’ll share it here publicly.
Turn notifications on.
Many people will wish they followed sooner.
🚨 IMPORTANT UPDATE
Pay attention. The signals are getting impossible to ignore.
This setup has not appeared once in the last 60 years.
Dismiss it if you want, but the risk is real.
The S&P 500 is hovering near all-time highs.
Sounds bullish.
But there’s something happening under the surface that very few investors are talking about.
The market structure is deeply distorted.
Price is being driven by a small cluster of companies rather than the broader U.S. economy.
After studying market structure for two decades, I can tell you this type of concentration is extremely rare.
Here is what the index actually looks like today:
Top 10 companies: ~36.8% of the entire S&P 500
Magnificent 7 alone: ~34% of the index
The other 493 companies are competing for what little liquidity remains.
The S&P has not been this concentrated since the mid-1960s — more than 60 years ago.
For comparison:
At the peak of the dot-com bubble, the top 10 companies made up roughly 27–29% of the index.
During the Nifty Fifty era, concentration sat around the mid-to-high 30% range.
Today we are right back in that territory.
And that creates a serious vulnerability.
If just a handful of these mega-cap names begin to roll over, the entire index could fall much faster than most investors expect.
Until this imbalance corrects itself, caution is warranted.
Personally, I don’t see it resolving anytime soon.
If anything, the divergence is getting worse.
Right now the ice is too thin for me to deploy large capital into equities aggressively.
For transparency, I’m still holding OIH, XLE and NTR, which I view as multi-year positions.
My focus remains on opportunities tied to energy and agriculture, not large-cap tech.
I’ll keep monitoring this closely and share updates as the situation develops.
When I start deploying capital again, you’ll see it here first. Just like every time before.
Remember, I’ve called every market top and bottom over the last 15 years.
And I’ll do it again.
Many people will wish they followed sooner.
🚨 BREAKING: The U.S. Treasury just bought back $15 BILLION of its own debt.
Largest Treasury buyback EVER.
Most people don’t understand why this matters.
But anyone watching the bond market does.
The Treasury market is $27 TRILLION.
It is the backbone of the entire financial system.
Every bank. Every hedge fund. Every derivatives market.
Everything sits on top of it.
U.S. debt just crossed $36 TRILLION.
The government is issuing roughly $1 TRILLION in new debt every 100 days.
At the same time, foreign buyers are stepping back.
China alone has reduced its Treasury holdings by hundreds of billions from peak levels.
Which leaves one problem… who absorbs the supply?
We’ve seen this movie before.
September 2019.
Funding rates jumped from 2% to nearly 10% overnight.
The Fed had to inject hundreds of billions just to stop the system from freezing.
Then came March 2020.
Treasuries themselves started collapsing during the COVID panic.
The Fed launched $1+ TRILLION in emergency purchases to stabilize the market.
Today: record debt. Rising yields. Foreign buyers pulling back.
And the government just executed the largest buyback in history.
When liquidity in the Treasury market tightens, volatility spreads everywhere.
Stocks. Crypto. Credit markets. Everything.
How do I know this?
I’ve been in macro for 15 years and predicted all the market tops and bottoms during that time.
When I EXIT the markets completely, I’ll say it here publicly, like I always do.
From now on, I’ll share my moves publicly. If you want to win big, follow and turn notifications on.
Many people will wish they followed me sooner.
🚨 THIS IS VERY BAD
Look at the chart.
Oil vs Call Volume.
Call buying just hit a 10 YEAR HIGH.
That means the entire market is leaning the same way.
Everyone is long oil.
And when positioning gets this crowded while war risk is rising, the setup becomes extremely dangerous.
Because the market is no longer reacting to headlines.
It is pricing escalation.
Trump is already saying there will be NO deal without capitulation.
That removes the idea of a quick diplomatic exit.
The market is preparing for a longer conflict and a bigger supply shock.
If this spreads, oil does not move alone:
- Capital rotates.
- Metals follow.
- Yields follow.
Liquidity starts leaving risk.
- Stocks lose support.
- Crypto loses support.
- Volatility rises.
Most people do not understand this.
A massive oil long is not just an energy trade.
It is a macro bet on fear and inflation.
And when too much money crowds into the same trade, the move accelerates.
You can already see it.
Sky cofounder opened a $5.7M crude long at $92.
At the same time options traders are buying upside exposure at record levels.
Call volume at a 10 year high tells you traders expect much higher oil.
Now add war escalation on top of that.
One headline and this trade gets chased violently.
Higher oil means higher inflation.
Higher inflation means higher yields.
Higher yields drain liquidity.
Stocks and crypto dump.
Capital is rotating into oil, gold and hard assets while risk markets fight for liquidity.
That is a market preparing for fear and escalation.
For the record, I was the only one publicly calling the exact Oil bottom at $40 one year ago and the top at $120 2 days ago.
If you missed those calls, don’t worry. I’ll call the next one too.
Turn notifications on. If you’re not following yet, you’ll understand why that was a mistake later.
🚨 The U.S. just posted its worst corruption score ever recorded.
The numbers:
64 out of 100
Back in 2015 it was 75.
The United States is now tied with the Bahamas on the global index.
It ranks below Uruguay, Barbados, and Lithuania.
And it hasn’t been inside the top 20 since 2017.
So what happened?
Investigations into foreign bribery were paused.
Enforcement of the Foreign Corrupt Practices Act slowed dramatically.
Oversight under the Foreign Agents Registration Act was weakened.
Transparency International is sounding the alarm.
Their CEO said they are “very concerned about the trajectory in the United States” and warned the decline could continue.
But the U.S. is not the only country sliding.
The UK, Canada, France, Germany, and Brazil also posted record-low scores.
The global corruption average has now dropped to 42, the lowest level in more than a decade.
Meanwhile, Denmark ranked #1 again for the eighth straight year.
And here’s the bigger picture.
Two-thirds of all countries now score below 50.
That means the majority of the world is operating in systems where corruption risk is high.
In simple terms:
Institutional trust is deteriorating globally.
When that happens, capital starts moving.
Systems weaken. Money rotates.
And the people paying attention position before the shift becomes obvious.
I’m already preparing a large hedge against this trend.
When the position is finalized, I’ll post it here publicly.
Turn notifications on if you want to see where the capital goes next.
A lot of people will wish they followed sooner.
🚨 THIS IS NOT GOOD
Oil just collapsed.
Prices dropped over 13% in the last 40 minutes.
Reports that G7 countries are considering releasing up to 400 million barrels from strategic reserves triggered the move.
That kind of intervention changes the supply picture instantly.
Billions of dollars wiped out.
We are approaching an extreme statistical event.
Something that has NEVER happened in modern history.
Do you understand what that means?
More value erased in minutes than the annual GDP of most European countries.
We have officially entered the FORCED LIQUIDATION PHASE.
This is what a liquidity vacuum looks like.
Funds are being margin-called.
They’re selling oil just to survive.
Do not hand them your wealth.
I’ve been in finance for more than 15 years.
When I EXIT the markets completely, I’ll say it here publicly, like I always do.
Many people will wish they followed me sooner.
🚨 UPDATE
On December 30 I told you to buy OIH and XLE.
Since then:
Crude oil at 5 years ATH.
OIH +23%
XLE +24%
And I’m not planning to sell yet.
Here is why:
Last week, the U.S. and Israel launched major strikes on Iran. Iran is now responding across the Middle East.
The headlines are loud but the real story is oil supply.
21% of the world’s oil moves through the Strait of Hormuz every single day.
That is the narrow shipping route between Iran and the Arabian Peninsula.
Iran controls one side of it.
Iran has already declared it closed.
Airports across several Gulf states are shut down. More than 3,000 flights have already been cancelled.
And remember something important.
Oil was already rising before this escalation.
Crude moved from about $55 in December to $92 today.
The geopolitical risk premium in oil is still clearly underpriced.
That is exactly why on December 30 I said this was not a short term trade.
I’ve been in finance for more than 15 years.
When I EXIT the markets completely, I’ll say it here publicly, like I always do.
Many people will wish they followed me sooner.
🚨 I CAN’T BELIEVE NOBODY IS TALKING ABOUT THIS
A lot of people will never actually retire.
The Social Security trust fund is projected to run dry by 2033.
That’s not speculation.
It’s straight from the Social Security Trustees Report.
When that happens, benefits automatically get cut by 23% overnight.
By law.
Think about what that means.
If you were expecting $2,000 a month, you’re suddenly getting $1,440.
That’s $6,520 a year gone.
For millions of retirees, that’s rent, medication, and groceries.
Now layer inflation on top.
Since 2020, the dollar has lost roughly 25% of its purchasing power.
Cost-of-living adjustments haven’t come close to keeping up.
So your benefit drops 23%, and the money you still receive buys far less than it does today.
You get hit twice.
But here’s the part most people don’t realize.
If you’re in your 40s right now, you’ve been paying into this system your entire working life.
By the time you qualify, the trust fund will likely have been empty for years.
You’ll be collecting reduced payments in a currency that buys a fraction of what it does today.
Nobody prepared you for that.
And that’s exactly the problem.
This is why a growing number of people in their 40s and 50s simply won’t retire.
Their 401(k)s took hits in 2020 and 2022, housing costs exploded, real wages barely moved, and the one program they thought they could rely on is mathematically insolvent.
Congress has known about this problem for over two decades.
Nothing meaningful has been done.
In fact, both political parties have used the issue for campaign talking points instead of fixing it.
And every year they delay, the solution gets worse:
Higher taxes.
Deeper benefit cuts.
Or both.
If you’re under 55 and your retirement plan depends on Social Security paying full benefits…
You don’t actually have a retirement plan.
The only realistic way to retire comfortably is to build income outside the system and start investing as early as possible.
I’ve been investing for more than 15 years, and I share my market moves publicly with my followers.
I’m preparing for one of the largest investments of my life, and when I execute it, I’ll announce it here.
Turn notifications on so you don’t miss it.
A lot of people will wish they had followed sooner.
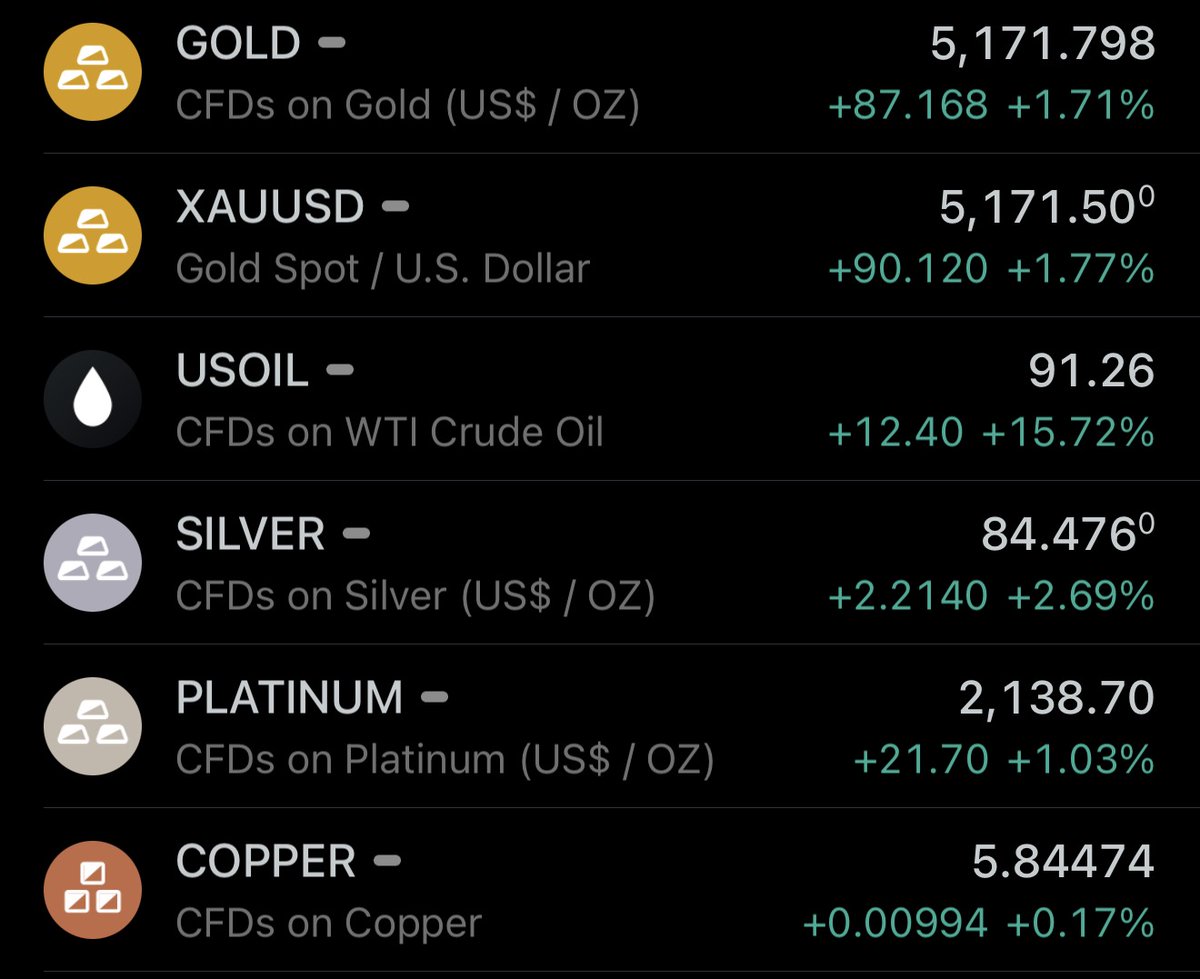
🚨 THIS IS NOT GOOD AT ALL
Take a look at the screen.
Gold rising.
Silver rising.
Copper rising.
Platinum and palladium moving higher.
Especially oil.
This almost never happens all at once.
Historically, when the entire commodity complex rallies together, it usually signals that system stress is building.
Here’s why it matters:
During normal economic expansions, commodities move independently.
Industrial metals respond to demand.
Energy follows growth cycles.
Precious metals usually move slowly and cautiously.
But when everything starts moving together, it often means capital is shifting away from financial assets and into hard assets.
We’ve seen this exact setup before:
– 2000 (Dot-Com Bubble)
– 2007 (Global Financial Crisis)
– 2019 (Repo Market Stress)
There isn’t a single historical example where this pattern didn’t eventually precede a recession.
Markets are effectively telling us a few things:
– The return is no longer worth the risk
– Debt levels don’t function at these interest rates
– Economic growth is weaker than it appears
When copper rallies at the same time as gold, that’s rarely bullish.
It typically happens when markets are mispricing demand, just before consumption slows and macro data catches up.
Economic data always confirms trends long after markets move first.
In late-cycle environments, equities often remain calm while real assets begin signaling something far more serious.
Remember, I was the only one publicly calling the exact bottom at $16,000 three years ago and the top at $126,000 in October.
If you missed those calls, don’t worry. I’ll call the next one too.
Turn notifications on. If you’re not following yet, you’ll understand why that was a mistake later.
🚨 GOLD JUST OVERTOOK U.S. TREASURIES FOR THE FIRST TIME IN 30 YEARS
It finally happened.
Just look at this chart…
The data is out, and it’s shocking.
Especially if you live in the United States.
For the first time in three decades, central banks now hold more gold than U.S. government debt in their reserves.
Confidence in the U.S. dollar is fading globally.
Foreign governments are no longer focused on earning yield…
They’re focused on protecting their capital.
And honestly, you can’t blame them.
U.S. Treasuries can be frozen, sanctioned, or inflated away.
Gold, on the other hand, carries zero counterparty risk.
It’s the only truly neutral reserve asset.
But the situation goes deeper.
U.S. debt is growing by $1 trillion roughly every 100 days.
Annual interest payments alone are now pushing past $1 trillion per year.
At some point, the system forces the Fed to print.
And the rest of the world sees exactly where this is heading.
YOU CAN SEE IT DIRECTLY IN GLOBAL RESERVES.
China. Russia. India. Poland. Singapore.
Country after country is rotating away from paper assets into hard reserves.
And then there’s BRICS.
This isn’t just about trade cooperation.
THE OBJECTIVE IS DE-DOLLARIZATION.
New payment networks outside of SWIFT.
Energy trade settled in local currencies.
Reserve systems backed by real commodities like gold and silver, not paper promises.
When nations representing 40%+ of the world’s population decide they don’t need the dollar anymore, global demand changes fast.
The era of TINA (There Is No Alternative) is ending.
Gold is becoming the alternative.
Is this the beginning of the dollar losing its global dominance?
Yes. It very well could be.
If you think gold at $6,000 and silver at $150 sounds extreme…
Then you’re probably not ready for what may come next.
Remember, I’ve predicted all the market tops and bottoms for the last 15 years.
When I EXIT the markets completely, I’ll say it here publicly, like I always do.
Many people will wish they followed me sooner.
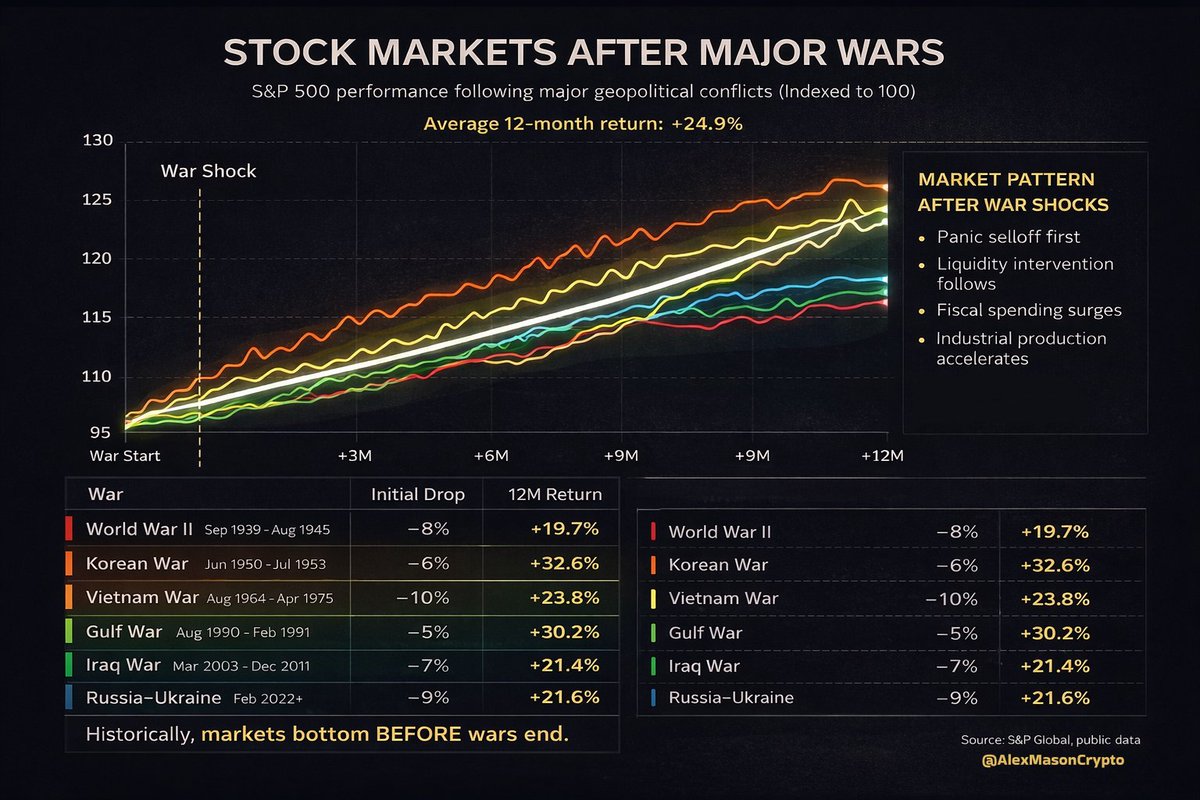
🚨 THIS HAS HAPPENED BEFORE
Everyone is focused on the headlines.
Missiles. Escalation. Panic.
But markets have seen this movie many times before.
And the pattern is always the same.
Look at the data.
After every major geopolitical shock in the last 80 years:
- World War II → +19.7% within 12 months
- Korean War → +32.6%
- Vietnam War → +23.8%
- Gulf War → +30.2%
- Iraq War → +21.4%
- Russia–Ukraine → +21.6%
Average return after major conflicts:
+24.9% in the following year.
That surprises most people.
Because the market rarely waits for the war to end.
It usually bottoms while the news is still getting worse.
Why?
Three reasons most people ignore.
First: uncertainty gets priced instantly.
Markets collapse when nobody understands what’s happening.
Once the event becomes clear, even if it’s negative, uncertainty starts to disappear.
Next: governments respond aggressively.
Wars trigger massive fiscal spending, industrial expansion, and liquidity injections.
Defense spending alone can reshape entire sectors.
Then: positioning.
When fear peaks, investors are already heavily de-risked.
The moment selling pressure exhausts itself, even small inflows push markets higher.
This is why markets often turn BEFORE the geopolitical situation improves.
Not after.
Smart money studies patterns.
Everyone else reacts to headlines.
And that difference is where most of the money is made.
Remember, I’ve called every market top and bottom of the last 15 years.
When I make a new move, I’ll say it here publicly, like I always do. And it's coming soon.
Many people will wish they followed me sooner.
🚨 BITCOIN IS BEING MANIPULATED, AND I HAVE PROOF
Everyone is talking about how Bitcoin went up $5,000 in 10 minutes.
Everyone’s posting about it…
But almost nobody is explaining what actually caused it.
Stop staring at the chart. Look at the flows.
Within minutes, wallets tied to Wintermute, Binance, Coinbase, and ETF-linked addresses all became active simultaneously.
Large blocks moving between exchanges.
MASSIVE market buys hitting thin order books.
Then suddenly…
THEY FLIPPED AND STARTED SELLING EVERYTHING.
Here’s what really happened:
– Liquidity was thin
– Leverage was stacked heavily on one side
– Funding rates were already stretched
So price gets pushed higher aggressively.
Why?
To trigger FOMO and, more importantly, force shorts out while pulling new longs into the market.
Once enough leverage was trapped…
They started unloading.
The data shows it clearly:
– Coordinated inflows to major exchanges
– Large market buys clustered within a narrow window
– Immediate reversal after stop levels were cleared
– Heavy selling right after liquidation zones were hit
This is how INSIDERS DUMP without crashing price.
They move the market toward liquidity, trigger liquidations, and then sell directly into the chaos they just created.
And it wouldn’t surprise me if they were running long and short positions simultaneously through separate wallets.
If you’re new to this market, understand one thing:
Bitcoin almost never moves like this because of headlines.
It moves when leverage builds up and someone with enough size decides it’s time to wipe everyone out.
Watch funding rates. Watch open interest. Watch where coins are moving, not who is posting charts.
For the record, I was the only one publicly calling the exact bottom at $16,000 three years ago and the top at $126,000 in October.
If you missed those calls, don’t worry. I’ll call the next one too.
Turn notifications on. If you’re not following yet, you’ll understand why that was a mistake later.