@MichaelKitces Most people never see, graphically, their portfolio risk. Diversification is a great tool to lower risk. If you are not tracking risk, all you see are past returns... it is easy to lose sight of the power of diversification if you do not see it on your client dashboard.
@MichaelKitces I would rephrase the first sentence to be “The goal of portfolio rebalancing is that it is a strategy to reduce long-term risk”. It works well for that goal. But the industry has not come around to giving risk its proper focus. I’ll wait.
I learned a lesson for the second time today... when updating your openclaw (today I was updating it to use a qwen local model as the default), don't use ChatGPT unless you want to waste copious amounts of tie. Use Grok. It nailed it in five minutes.
Both Goldman Sachs and Apollo are forecasting 3% annualized S&P 500 returns over the next decade.
That's not a typo. Three percent.
Meanwhile, most advisors are still building portfolios like it's 2012 — 60/40, set it and forget it, "stay the course."
If your advisor's plan for the next 10 years looks identical to the last 10, that's not a plan. That's hope.
Diversification isn't just owning 500 stocks instead of 50. It's owning things that don't move together — gold, alternatives, assets most advisors won't touch because they can't explain them in a quarterly letter.
The next decade rewards the prepared, not the passive.
@leveragedbets Bro, I was once interviewed by the “dividend” guy at Barton’s. I said “I don’t get it, the whole dividend thing. When you get the dividend, the stock drops and I now owe taxes on the dividend”. Needless to say, that interview did not go well 😂
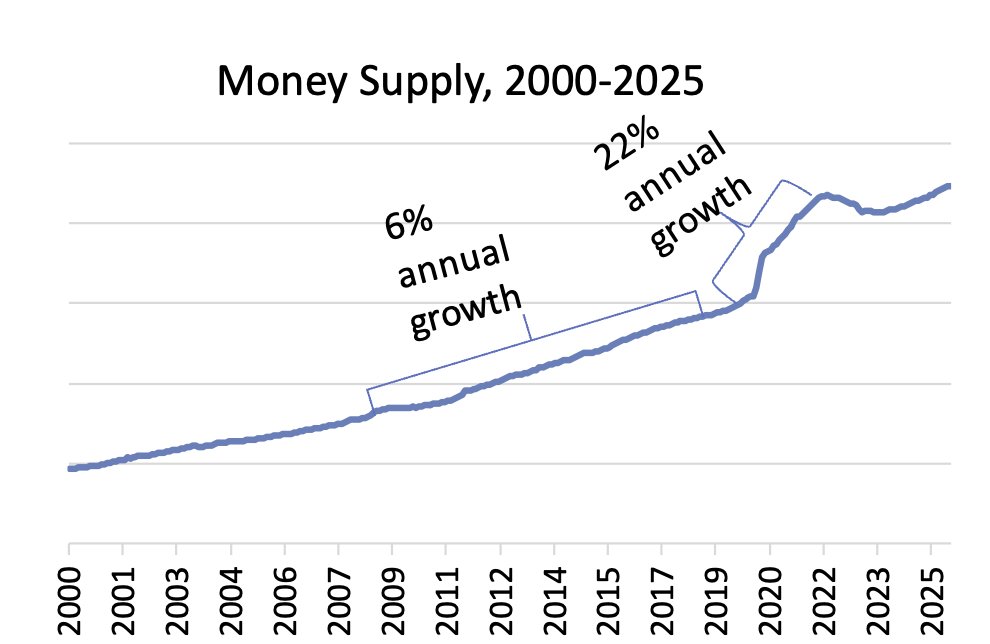
During COVID, the U.S. money supply grew 26% in less than a year and a half. Even in the decade prior, since the Global Financial Crisis, it grew at a brisk 6% per year. In total, the money supply has expanded by about 40% in the five years since COVID. You read that right: 40% of all dollars in existence have been printed since COVID. You can see this clearly in the first chart covering the long-term history of money supply.
There are many reasons for gold’s recent rise: foreign government buying, geopolitical uncertainty, and shifting reserve preferences, among others. But historically, large expansions in the money supply have often coincided with major gold rallies.
What This Means for Your Portfolio
None of this is to suggest that gold will continue rising. 64% returns are rare.
Gold’s role in a diversified portfolio is not to outperform; its role is merely to behave differently. It tends to respond well to monetary instability, currency debasement, and periods of uncertainty or volatility, often when other assets struggle.
This is why we treat gold not as a speculation, but as a diversifier.
The same philosophy applies across the entire portfolio. Rather than betting on any single asset, we spread exposure across assets that behave differently under different economic conditions. Some years, one area will dominate. Other years, something else will. Our job is not to guess which one will lead next; it is to ensure you are not overly dependent on any single outcome.
2025 was a reminder of why this approach matters. Returns were strong, leadership was broad, and diversification worked as intended.
That is not an accident. It is the design.
Randy Kurtz
Every great year in markets tells a deeper story. This one was about money, gold, and why portfolios should never depend on a single bet. Below I discuss this in my recent quarterly letter to investors, highlighting why gold is not a bet on price increasing, but is a diversifier.
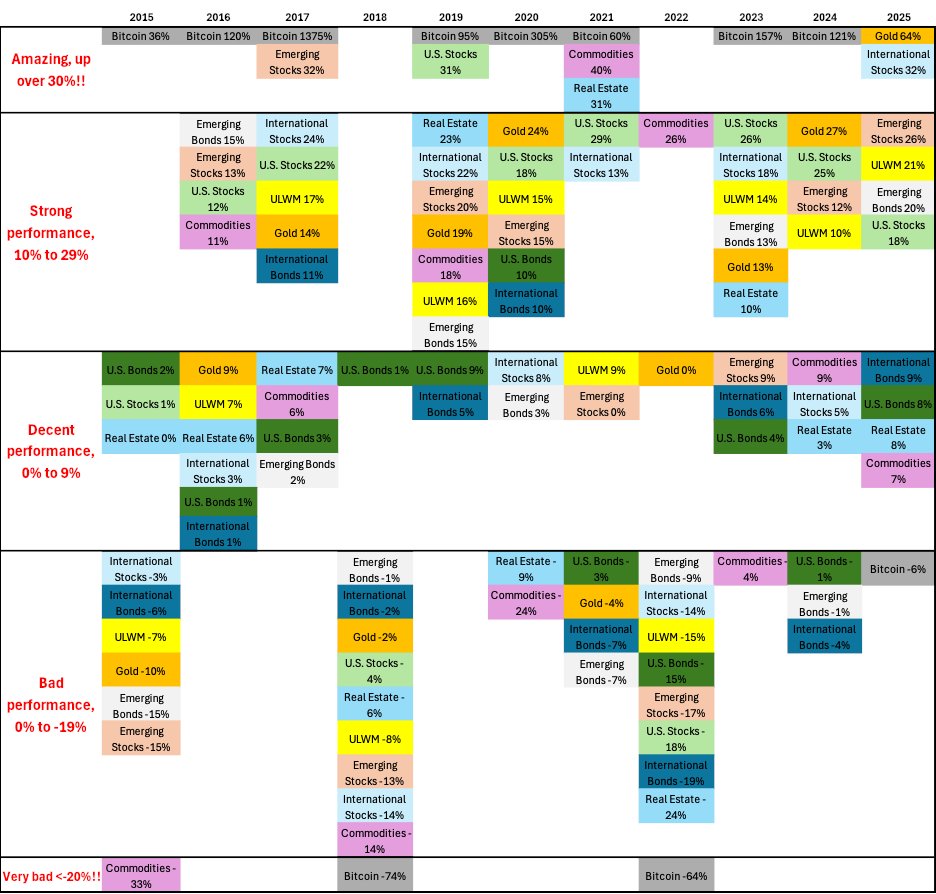
Our Core portfolio delivered a 21.1% return last year, the highest annual return to date. Most assets were materially positive in 2025, led by gold (up 64%), international stocks (up 32%) and emerging market stocks (up 26%).
Last year, we introduced a chart ranking ten asset classes by their performance in each of the past ten calendar years. The chart is grouped into sections—such as “Amazing, up 30%+”—with some years having no assets in a given category and others having several. Below is that chart, updated for 2025:
Tensions came to a head when France began redeeming dollars for gold at $35 per ounce and shipping the gold back to Europe. By 1971, U.S. officials understood that continued conversions would exhaust the nation’s remaining gold. Rumor has it that in early August of 1971, a French warship was headed toward New York Harbor, ready to unload a battleship’s worth of paper currency for gold.
On August 15, 1971, Richard Nixon announced that the United States would end the convertibility of dollars into gold, closing the gold window and ending the Bretton Woods system.
The result was a fundamental shift in the global monetary order. Currencies began floating freely against one another, and the world entered the modern fiat currency era. No word on the fate of that French captain when he returned home with a ship full of paper.
Following that change, gold rose 49% in 1972, 73% in 1973, and 66% in 1974. Printing vast sums of money meant that the value of the dollar declined relative to gold. Or was it that gold rose relative to the dollar?
Fast-forward to today.
Here’s what has happened to the money supply since 2000:
@MichaelKitces Risk scores are stupid. It’s like a doctor asking you “you need heart surgery but… wha is your pain tolerance? That will dictate my advice”. The amount of risk a client can take is dictated by their financial position. It is not a personal preference.
@kevinxu Obvious take bro. In the worst case paying taxes and fees to liquidate and then investing for 20 years still gets you over $10m liquid on paper.