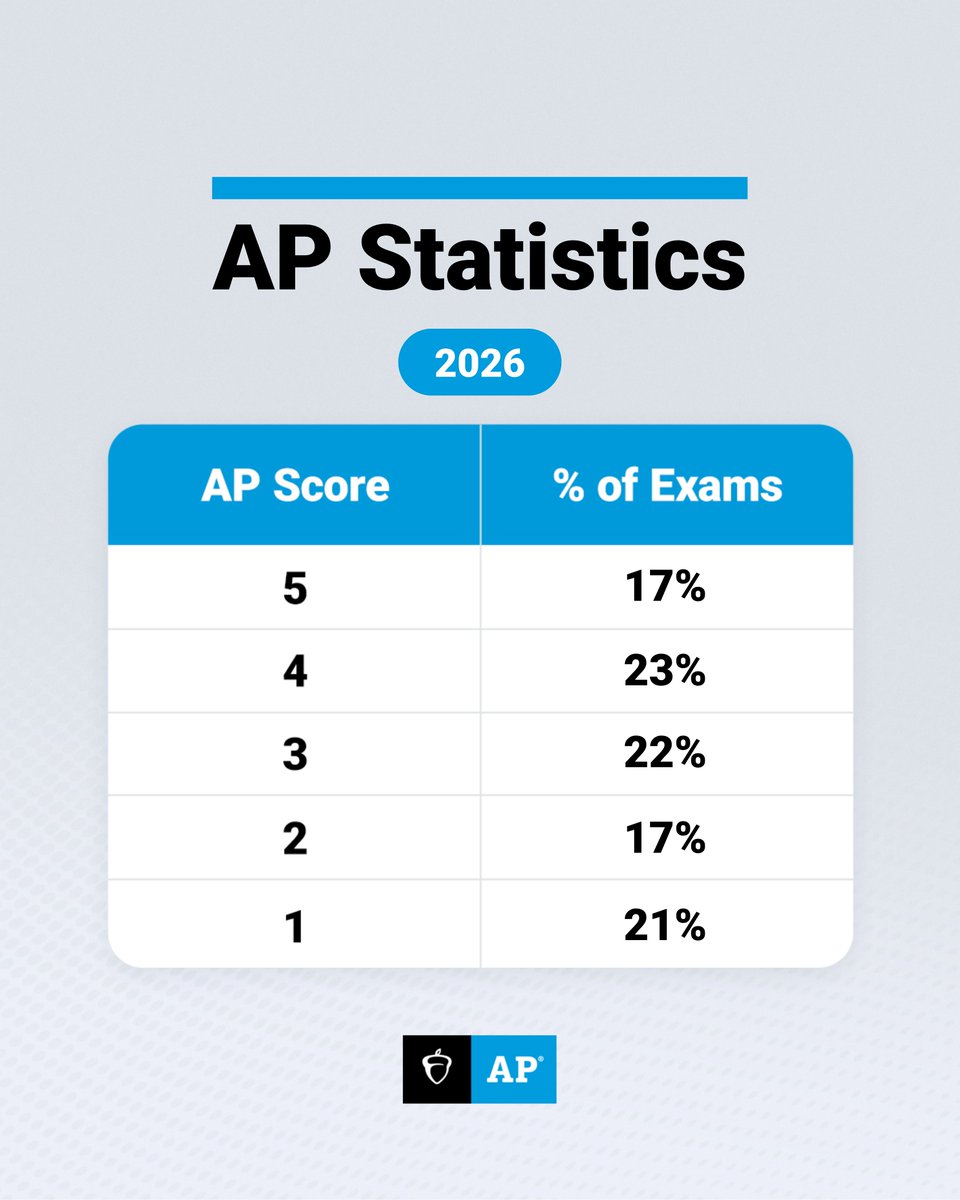
The 2026 AP Statistics Exam scores:
5: 17%; 4: 23%; 3: 22%; 2: 17%; 1: 21%
The 2026 AP Statistics exam was taken by 281,000 students, ~2% of the U.S. high school population.
AP Statistics Multiple-Choice Questions (MCQ):
1. Students performed strongest on questions related to Units 1 and 2 (Exploring One-Variable and Two-Variable Data). The high performance here indicated that many AP Statistics students have solid foundational skills in summarizing and interpreting distributions. To receive an AP 5, students were expected to answer all 10 of these questions right, while to receive an AP 4, students were expected to miss no more than one; students receiving AP 3s were expected to answer 7/10 correctly.
2. The most challenging MCQ content area was Units 4 and 5: Probability and Sampling Distributions, a conceptually demanding area that requires students to reason about randomness, probability rules, and the behavior of sample statistics — the theoretical backbone of all of statistical inference. Accordingly, the difficulty level of these questions is such that they serve well to identify students who qualify for an AP 5.
AP Statistics Free-Response Questions (FRQ):
https://t.co/Xkhzq3y53E
Across this 90-minute section, students were asked to calculate five-number summaries and compare distributions, design a randomized experiment and interpret statistical significance, apply normal and binomial probability models, conduct a two-sample t-test from summary statistics, analyze a two-way table with conditional probabilities and a chi-square readiness check, and work through a multi-part linear regression analysis complete with confidence and prediction intervals. In other words, the faculty committee who designed these questions did a wonderful job of replicating the scope of a first college-level course in Statistics — no corners cut.
(As I think about what AP teachers do so admirably, this is one of those moments where I feel such awe and gratitude for the ways teachers use the scope of the exam to ensure the students in their class have the benefit of no topics falling by the wayside. There are so many pressures on teachers to let stuff slide – from snow days to spring fever to parents demanding that their children receive high grades – but AP teachers tell me all the time that they’re able to invoke the AP Exam’s demands as a reason for maintaining high standards and motivating students to spend the extra time on task that learning at the advanced level in high school demands. The TIMSS study found that AP students were studying two more hours per week than students taking a similar curriculum without a culminating AP Exam. No wonder the AP students in the study outperformed students from all other countries – that two additional hours of study each week makes a huge, cumulative difference in student learning. But this is also an important reminder that with such a significant amount of additional work, students should not be pressured to take more than 1-2 AP courses per year in high school – the load that the AP Program’s own research shows is sufficient to optimize college completion rates.)
Since AP scores are reported on a 5-point scale, the free-response questions deliberately include some very difficult points, designed to differentiate AP 5s from AP 4s, points of varying difficulty to differentiate AP 4s, 3s, and 2s, and more foundational points to separate AP 2s from AP 1s.
Q1, Exploring Distributions: asked students to determine a five-number summary from raw data, use it alongside a boxplot to compare center and variability in context, and then explain via a stem-and-leaf plot the shape characteristics a boxplot inherently conceals. This last task, asking students to articulate why a summary representation loses information about gaps or clusters in a distribution, is a sophisticated statistical reasoning skill, which distinguished scores of AP 4 and AP 5 from the other scores. Otherwise, this was the easiest FRQ, generating data essential to differentiating between AP 1s, which were only expected to earn at least 1 of these points, from AP 2s, which were expected to earn at least 2 of the 4 points possible here.
Q2, Experimental Design and Statistical Significance: was the most challenging short free-response question, providing opportunities to identify students who should receive a 5 versus those who should receive a 4. Students had to identify treatments, experimental units, and the response variable; describe a randomization procedure; and interpret the meaning of statistical significance in context.
Q3, Probability Models: required students to apply three distinct probability models in a single question — normal, binomial, and geometric — in the context of a sports team's game-opening musical performances. Students calculated a normal probability, used the binomial distribution to find P(X ≥ 3) across ten games, and then switched to the geometric distribution to calculate the mean and standard deviation of the number of games until a long performance occurs — and interpret that standard deviation in context. This question was almost as demanding as Q2, with each part building on independent probabilistic reasoning skills, such that it served to distinguish between AP 3s, 4s, and 5s, who are expected to earn some or all of these points, while students unable to engage with any parts of this question are receive 1s and 2s.
Q4, Two-Sample t-Test: presented students with a randomized experiment comparing two fertilizer brands across 116 trees. Given summary statistics for both groups, students had to conduct a full two-sample t-test: stating hypotheses, checking conditions, computing the test statistic, finding a p-value, and drawing a conclusion in context at the α = 0.05 level. The ability to execute all steps of a significance test accurately — and communicate conclusions appropriately — is a cornerstone of college-level Statistics and this question does an excellent job, across its four points, of differentiating the knowledge and skills of a wide range of performance levels: students are expected to score perfectly here to receive an AP 5, earn at least three of the points to earn an AP 4, and at least two of the points to earn an AP 3.
Q5, Two-Way Tables, Conditional Probability, and Chi-Square Readiness: gave students a two-way table of 4,193 professional basketball, football, and baseball players categorized by age group. Students were asked to calculate and interpret conditional probabilities, read a mosaic plot, reason about mutual exclusivity and independence (showing work numerically), and assess the conditions for a chi-square test of independence. This question contains several especially difficult points that evaluate students’ qualifications for an AP 5, which students receiving the other AP scores are unable to earn.
Q6, Linear Regression: Inference, Confidence Intervals, and Prediction Intervals: was the capstone 4-point investigative task, and it asked students to engage deeply with linear regression analysis using data from 30 professional baseball teams. Students described a scatterplot relationship, used a least-squares regression equation to make a prediction, compared a circled outlier team to others of its salary class, evaluated the relative strength of linear association across high- and low-salary subgroups, calculated both a 95% confidence interval for a mean response and a 95% prediction interval for a single team, and — in the most sophisticated part — explained why prediction intervals are wider than confidence intervals by connecting the conceptual logic of individual-vs.-mean variability to the mathematical structure of the standard error formulas. This question provides a variety of opportunities for students aiming for AP 4s and AP 5s to distinguish themselves, as several of these are quite advanced points.
All subjects' AP score distributions for 2026 will be posted here when available: https://t.co/OrkaQhPZYO
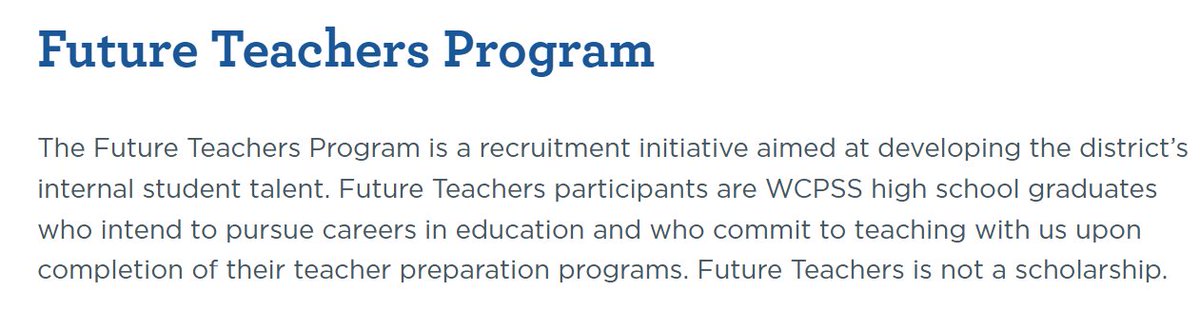
🚨 Interested in becoming a teacher? 🚨
The WCPSS Future Teachers program is designed to support and develop the talents of WCPSS high school grads who plan to pursue a career in education and return to teach with us after college! 🌟
Register Here:
https://t.co/hbQ6Sz9Pcp
🎊 We’re celebrating #WorldTeachersDay in style! 🎊
Reply to this post and tag a teacher who goes above and beyond for their students and community.
Each tagged teacher = $1 towards an Amazon Gift Card.
The total number of tags after 24 hours = the total gift card value! 🤑
Good luck, and get tagging - the winner is chosen at random!