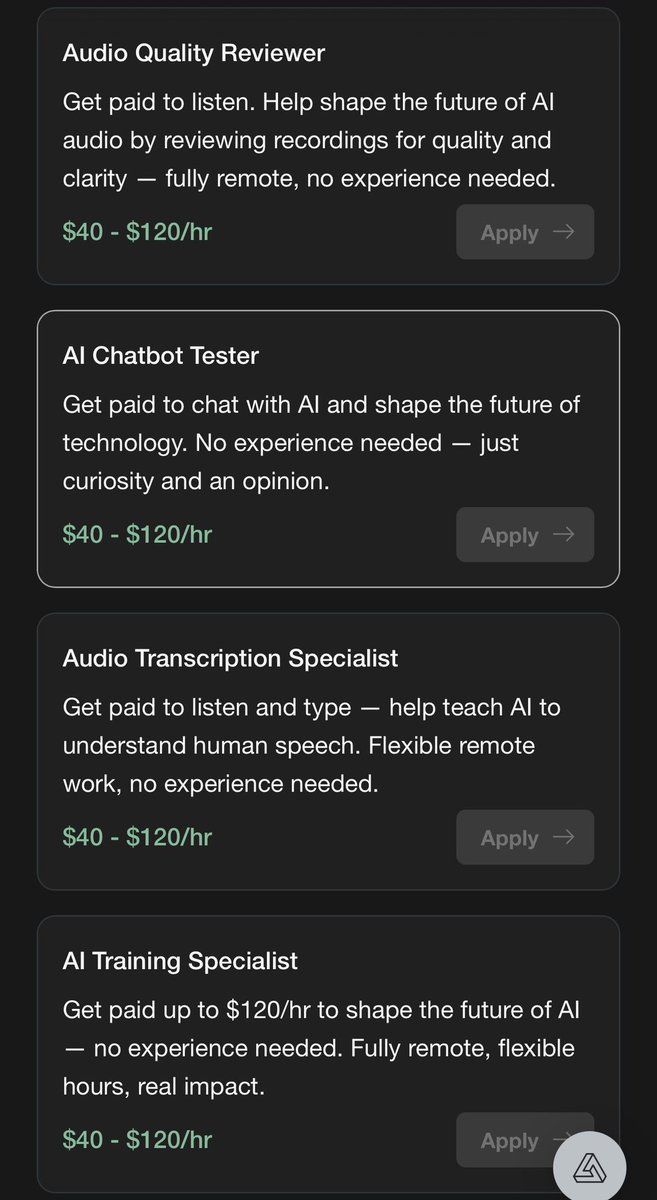
But in all honesty, ask yourself this, why is this guy not actually taking the work? Why hasn't he opened a big company and hired so many jobless youths? He says "No tech background" so you would think it would be easy
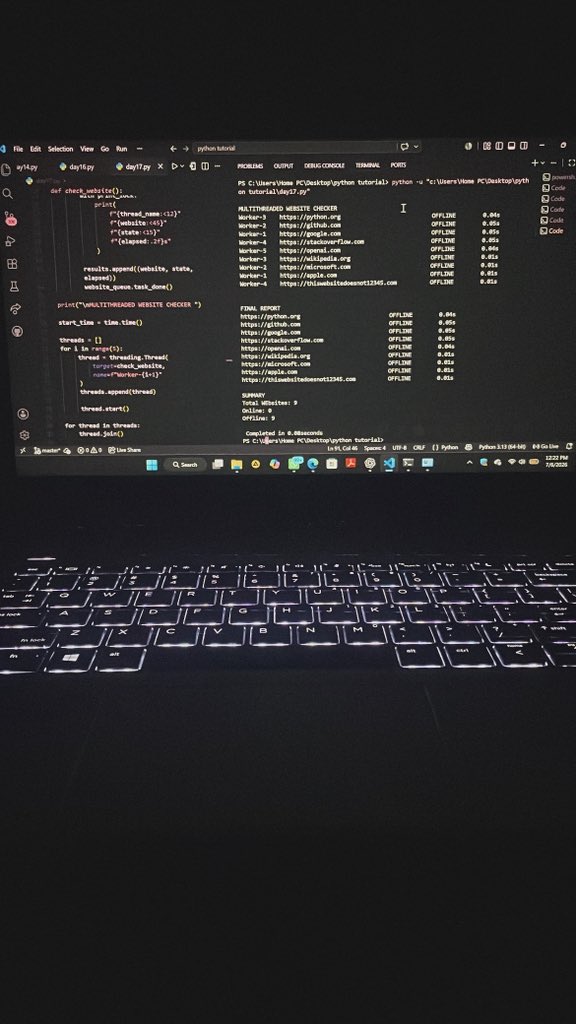
I worked on a multithreaded Website Status Checker using threading, Queue, Lock & requests. It checks multiple websites concurrently with thread synchronization
Image 1: no internet = all OFFLINE
Image 2: after reconnecting, ONLINE, 403 response& OFFLINE websites was recognized
📁 Data engineers: your pipeline is only as good as the file formats you choose.
Know these essentials:
• CSV – Simple & universal
• JSON – APIs & semi-structured data
• Parquet – Columnar, compressed & analytics-ready
• Avro – Schema evolution & streaming
• ORC – Optimized for big data workloads
Master the format. Master the pipeline. 🚀
#DataEngineering #BigData #DataAnalytics #ApacheSpark #ETL #DataEngineer
Master the format. Master the pipeline. 🚀
#DataEngineering #BigData #DataAnalytics #DataEngineer
📌How Data Analysts Turn Dashboards Into Real Business Decisions (Beginner-Friendly Guide)
I used to think dashboards were all about colors, charts, and beautiful visuals.
But after working with real businesses, I realized something important:
A dashboard can look perfect and still fail to solve any business problem.
Many beginners get stuck here, they learn charts, but not data storytelling.
So today, I want to break down how data analysts think when building dashboards so the charts actually help companies make decisions.
If you’re a beginner, read slowly.
1️⃣ Before choosing charts, ask yourself:
“What decision should this dashboard help someone make?”
Dashboards don’t exist for decoration.
They exist to guide decisions like:
•Which product to restock?
•Which branch is underperforming?
•Where are customers dropping off?
•What’s causing revenue to decline?
Once you know the decision, your chart choice becomes intentional, not random.
2️⃣ Use charts as tools to tell a story, not just to display numbers
Here’s how analysts think about charts:
Bar Chart → “Which category is winning or losing?”
Sales by product, visits by branch, profit by region.
Line Chart → “How are things changing over time?”
Revenue trend, customer growth, monthly churn.
Pie / Donut Chart → “What’s the share or distribution?”
Expense breakdown, sales proportion, user demographics.
Scatter Plot → “What correlates with what?”
Does marketing spend increase revenue?
Does age affect loan approval?
Histogram → “What patterns exist inside the data?”
Customer age distribution, sales size frequency.
Heatmap → “Where is the problem loudest?”
Website hotspots, operational bottlenecks, churn clusters.
When you choose the right chart, the insight becomes obvious without explanation.
3️⃣ Data storytelling means guiding someone through the insight, step-by-step
Instead of dumping charts, think like this:
“Here’s what’s happening → here’s why → here’s what we should do.”
For example:
•The bar chart shows tea sales are dropping.
•The line chart shows the drop started after a price increase.
•The heatmap shows complaints increased in the same period.
Insight: Price increase may be driving customers away.
Decision: Consider a discount or new value offers.
That’s storytelling, not dashboards.
4️⃣ A dashboard that doesn’t trigger action is just decoration
Your dashboard is successful when:
•A manager changes strategy
•A team launches a new campaign
•A branch gets attention
•A cost gets reduced
•A process improves
Charts don’t solve problems, the decisions they inspire do.
👉 If this was helpful, save it and watch out for more , where I’ll break down how to write insights from charts without sounding confusing, even as a beginner.
Stay consistent, that’s how your dashboards become decision-making tools, not just visuals.
Day 7 of learning SQL
Today, I started following Data with Baraa's SQL course, and it made some of the concepts I'd been learning over the past week much clearer.
Today's practice was on ORDER BY and GROUP BY.
Can't wait to see how far I can cover and practice before the week is over ...
BENEFITS OF NOT MASTURBATING
- Clear skin
- Confidence
- More energy
- Better mood
- Self-respect
- More strength
- Better discipline
- Better chances with women