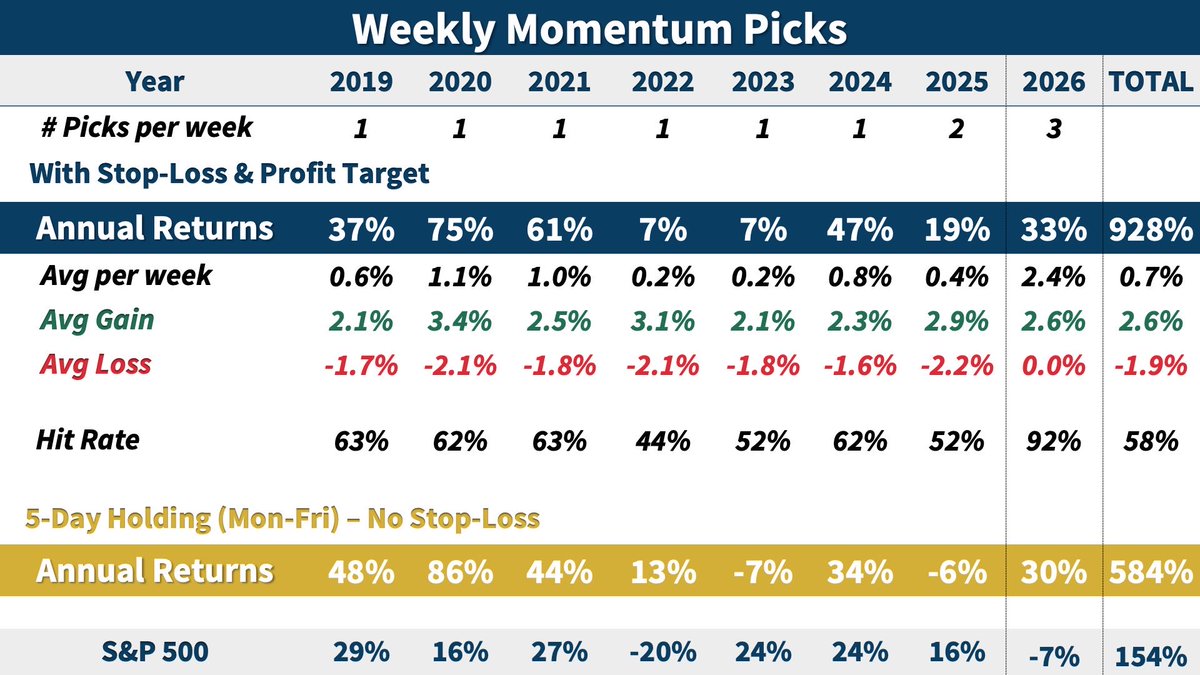
🚀 +800% returns since 2019 — that’s what my proprietary momentum algorithm has delivered.
Tired of guessing in volatile markets? Get clear, high-conviction trades delivered straight to your inbox.
Here’s exactly what you receive as a My Weekly Stock subscriber:
→ Every Sunday: 3 momentum stock picks - each with a complete 5-day trading plan
→ Every Friday: Weekly Market Recap - what moved, the data that mattered, and key insights
→ Last Wednesday of every month: Momentum Pulse Check - deep analysis of market regimes and trend strength
Everything runs through a disciplined, research-backed momentum system I’ve refined for years. No noise. Just actionable edge.
Join 10,000+ traders already using it.
💌 Subscribe now and get the full system: https://t.co/41b1RKx4gU
Follow @MyWeeklyStock for bonus momentum charts, quick insights & market commentary between issues.
@BullTheoryio $82k is where the 30-week EMA lies, the first boss for this rally. For 2 weeks we have hit that trendline and failed to clear it. Will it hold again next week?
That's a wrap for this week, one where Energy and Defensives were the only bright spots
Here’s how the 11 S&P 500 sectors performed last week:
🟢Energy $XLE 6.7%
🟢Health Care $XLV 1.1%
🟢Consumer Defensive $XLP 0.6%
🟡 Technology $XLK 0.4%
__S&P 500 $SPX 0.1%__
🟡 Financials $XLF -0.2%
🔴Communication Serv. $XLC -0.7%
🔴Industrials $XLI -1.1%
🔴Utilities $XLU -1.9%
🔴Materials $XLB -2.5%
🔴Real Estate $XLRE -2.7%
🔴Consumer Cyclical $XLY -3.1%
Curious about the week's highlights and what's coming next? I break it all down in my weekly market recap - LINK IN BIO 💌
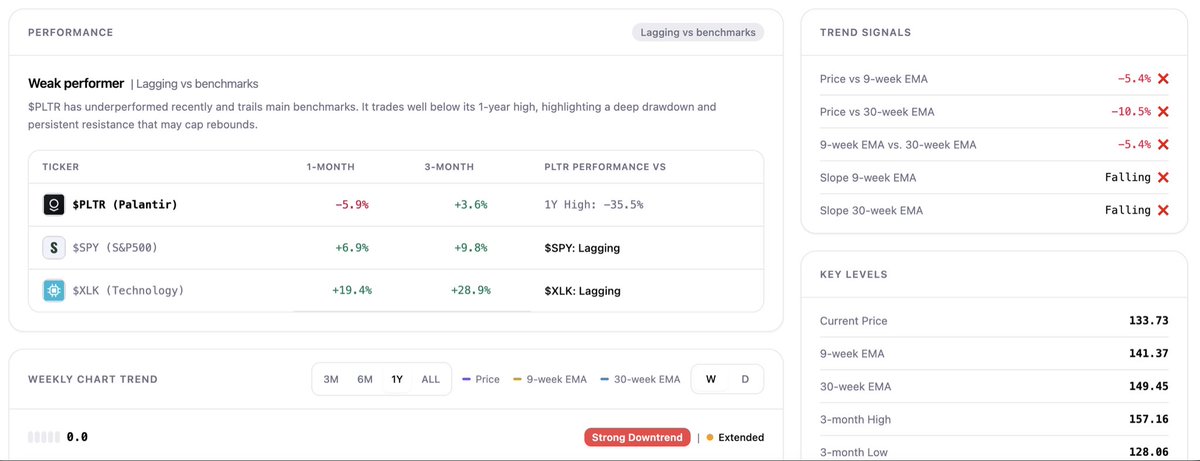
📌 Palantir ($PLTR): Strong Downtrend But Is the Selloff Getting Exhausted?
With the latest earnings report just behind us, it’s a good time to review my outlook on $PLTR, using signals from my proprietary Momentum Pulse Check model.
Trend Rating:
☆☆☆☆☆ (Weekly Chart)
➡️ Strong Downtrend - Outlook: EXTENDED
My take: PASS
•$PLTR has had a brutal run in 2026 and is down 37.2% from its 1-year high, lagging both $SPY and the Tech sector significantly. Price is trading well below both the 9- and 30-week EMA, with both averages still falling.
•That said, the move is getting stretched. The price is now extended to the downside, which typically signals that downside exhaustion may be near. A short-term rebound or consolidation would be typical before any potential next leg down.
•I need to see a reclaim of the 30-week EMA, currently above $149, to confirm a potential trend reversal. Needless to say, that is still a long way to go, and until then, I remain on the sidelines.
What's your take on $PLTR? Is this a good buying opportunity here, or is it still too early?
Momentum Pulse Check: Which Sector Has the Best Trend?
I evaluated the trend strength of the SP500 Sectors, using my proprietary "Momentum Pulse Check", which scores trends based on the 9- and 21-day EMAs (out of 5 stars):
✅ Price above both EMAs
✅ EMA 9 > EMA 21
✅ Both EMAs rising
= Strong trend
Here’s what my momentum model shows:
1) Uptrend:
•$XLK (Technology): ⭐⭐⭐⭐⭐
•$XLP (Consumer Defensive): ⭐⭐⭐☆☆
3) Sideways:
•$XLY (Consumer Cyclicals): ⭐⭐☆☆☆
•$XLI (Industrials): ⭐⭐☆☆☆
•$XLRE (Real Estate): ⭐⭐☆☆☆
•$XLV (Healthcare): ⭐⭐☆☆☆
•$XLC (Communication Services): ⭐☆☆☆☆
•$XLF (Financials): ⭐☆☆☆☆
•$XLB (Materials): ⭐☆☆☆☆
3) Downtrend:
•$XLE (Energy): ⭐☆☆☆☆
•$XLU (Utilities): ☆☆☆☆☆
In short: Only the Tech sector is firing on all cylinders, trading in a clean strong uptrend, near its 1-year high. The rest of the market is largely drifting sideways and the leadership is too narrow. Worth watching whether the other sectors start catching up, or whether Tech eventually rolls over and brings the whole market down.
What is you favorite Sector at the moment?
@DavidLund6@philrosenn I don’t disagree. It may still have massive upside.
I was pointing out that the PE ratio is irrelevant in my opinion here, especially when comparing to other less cyclical tech companies.
So many ways to blow up a trading account.
I’ve personally tested several of them.
The worst ones:
• Averaging down on losing positions
• Overtrading after a bad streak
• Chasing quick gains with leverage I didn’t fully understand
• Trying to outsmart my own trading plan
• Entering trades with no exit plan
Most trading mistakes aren’t complex. They’re just lack of discipline.
Which one have you been guilty of?
@StockMKTNewz Sentiment follows price and never fails. In the next correction, they will reduce their forecast. These targets are not useful for any serious investor.
@Polymarket With inflation picking up, the new Fed chair would have a hard time justifying a cut and not being seen as just trying to please the White House.
@BBizman62112@philrosenn “This time is different”
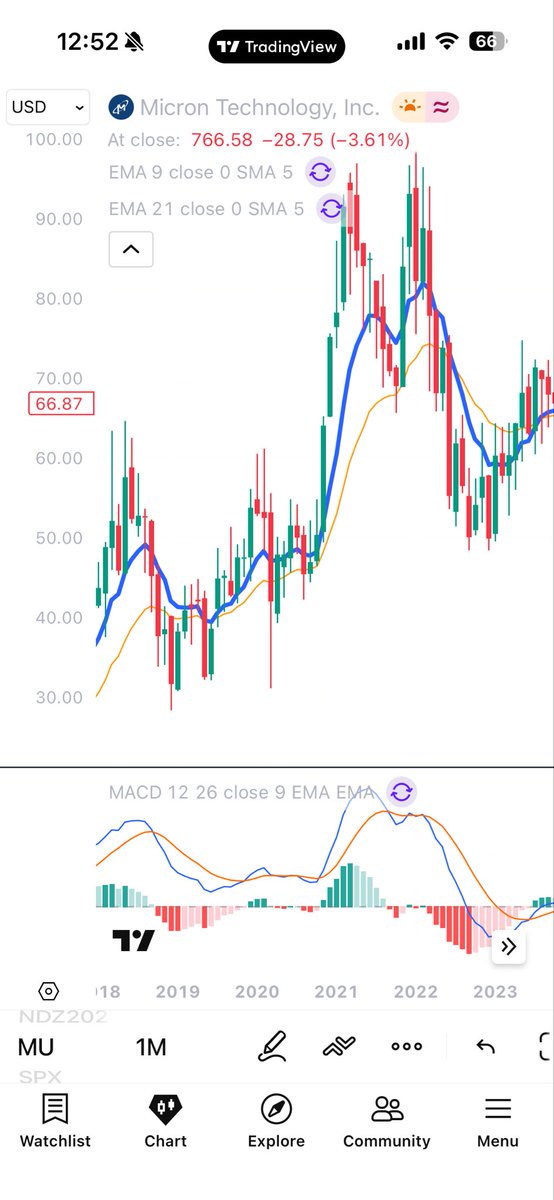
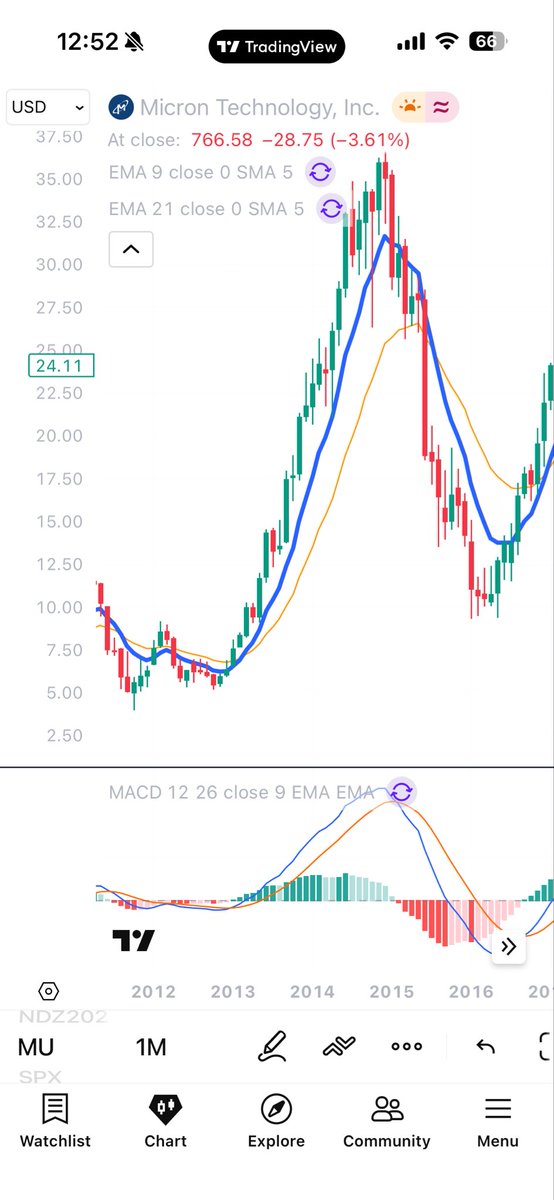
Meanwhile here are some examples when MU ran strong and crashed hard in past 30 years.
I dont have a crystal ball but I’d be careful assuming this is gonna run forever without a deep drawback
What a shift in momentum in a few months. Clear strong uptrend based on the weekly chart, but getting extended. Trading 15% above the 9-week EMA is a huge margin, especially for a healthcare stock. Within 5% is what I see as healthy, as the 9-week EMA is always inevitably catching up. Momentum is undoubtedly positive but don't chase here as we likely see some consolidation.
@TrendSpider@DailyStockPick3 Love the setup here. Still in a downtrend but objectively warming up and setting up for a reversal. Back above the 30-week EMA is the go signal for me.
Mega Caps vs. 1-Year Highs: Who's Holding and Who's Lagging?
Here’s how the top 20 largest U.S. stocks are trading relative to their 1-year highs:
🔥 Strong Momentum (Down less than 5%):
$AAPL (Apple): -1%
$NVDA (NVIDIA): -1%
$AVGO (Broadcom): -2%
$AMD (Advanced Micro Devices): -2%
$INTC (Intel): -2%
$MU (Micron): -3%
$GOOG (Alphabet): -3%
$AMZN (Amazon): -3%
����Holding it Together (Down 5%-10%):
$COST (Costco): -6%
$BRK.A (Berkshire Hathaway): -7%
⚠️ In Correction (Down 10%-20%):
$TSLA (Tesla): -11%
$JPM (JP Morgan): -11%
$JNJ (Johnson & Johnson): -12%
$V (Visa): -14%
$LLY (Eli Lilly): -15%
$XOM (Exxon Mobil): -15%
📉 In Bear Market (Down >20%):
$META (Meta Platforms): -25%
$MSFT (Microsoft): -26%
$ORCL (Oracle): -44%
Some of the world's largest companies are down more than 20% from their highs. Are any of these on your buy list?