@DatastoriesMU project, 3 artist/writer in residence posts - if you have any questions about roles we're holding an online info session about posts, Aug 13th, 14.00. Teams link is in the job booklet https://t.co/qLfBWwe1tu
We are recruiting :
Seeking a Data Visualisation Specialist for a 1-month contract at the University of Warwick. Strong Python & machine learning skills required.
Apply by Aug 7th!
#dataviz#python#machinelearning#researchjobs
https://t.co/gZT00t0Msr
Call for Papers: Special Issue on Critical Data Visualization
Submissions due: 31 October 2024
https://t.co/IOLhGJst15
Guest editors:
Georgia Panagiotidou
Andrew McNutt
Derya Akbaba
Nicole Hengesbach
Miriah Meyer
As my PhD comes to an end, I'm looking for a job
Slide into my DMs if you are in need of
🤓 a data nerd
💡 strong UX, UI and frontend skills
📈 love for datavis
🏃 leadership experience
📝 an experienced designer with a research mindset
or share this tweet and say sth, nice :)
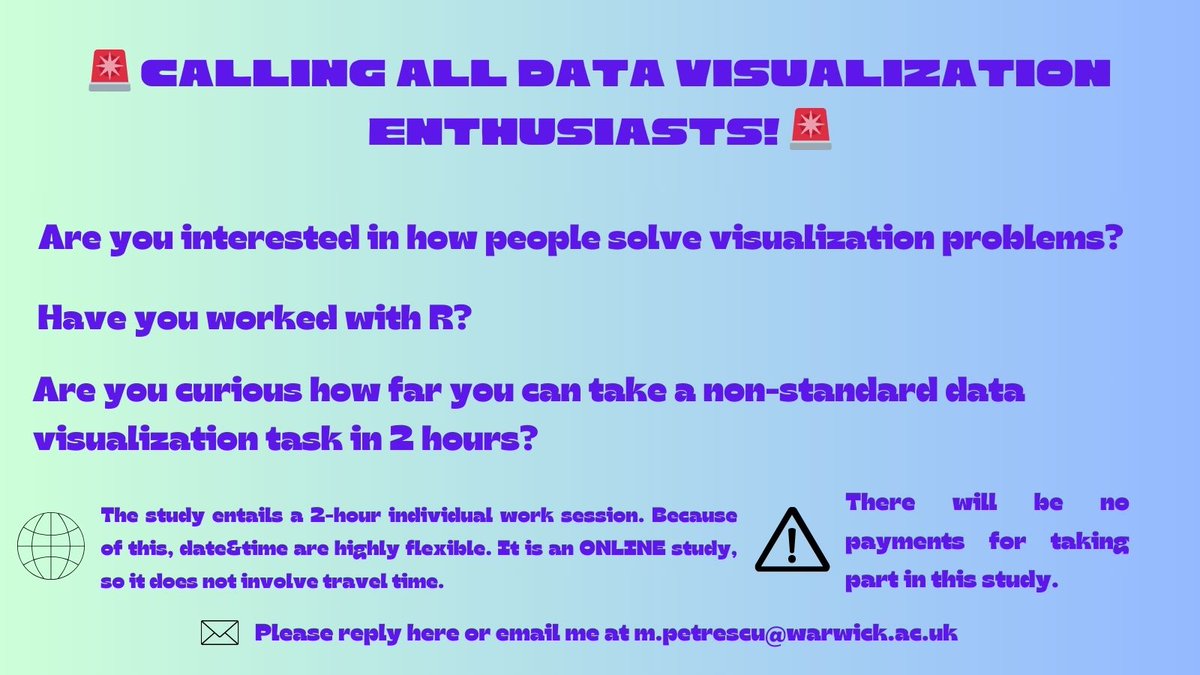
Hi everyone! As part of my PhD research (@CIMethods), I am organising a workshop study with three available dates for attendance (on campus) next week.
Dates available (all at 2-5pm):
- Monday (22.04) - in collaboration with @WarwickRUG
- Tuesday (23.04)
- Thursday (25.04)
CIM is thrilled to announce our upcoming Centre for Doctoral Training in Diversity in Data Visualization (DIVERSE-CDT) with colleagues from @CityUniLondon The #CDT will be recruiting over 60 PhDs starting October 2025. #dataviz#EPSRC_CDTs
https://t.co/ZIVwQTcBdb
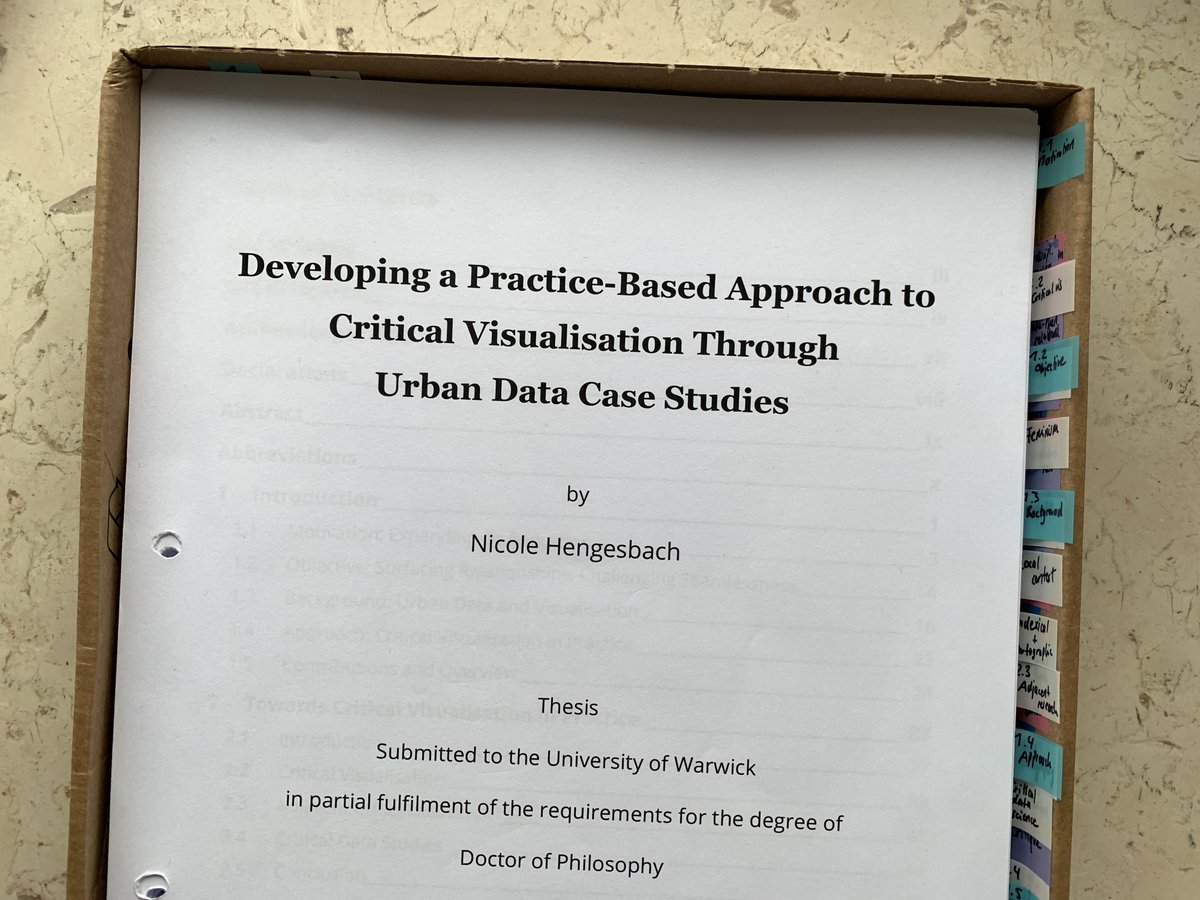
It’s still setting in but I passed my PhD viva with minor corrections last week! I want to thank the examiners @cagatay_turkay and Peter A. Hall (@UAL) and my supervisor Greg McInerny (@CIMethods) for a wonderful viva experience and @j_p_albuquerque for the support from afar.
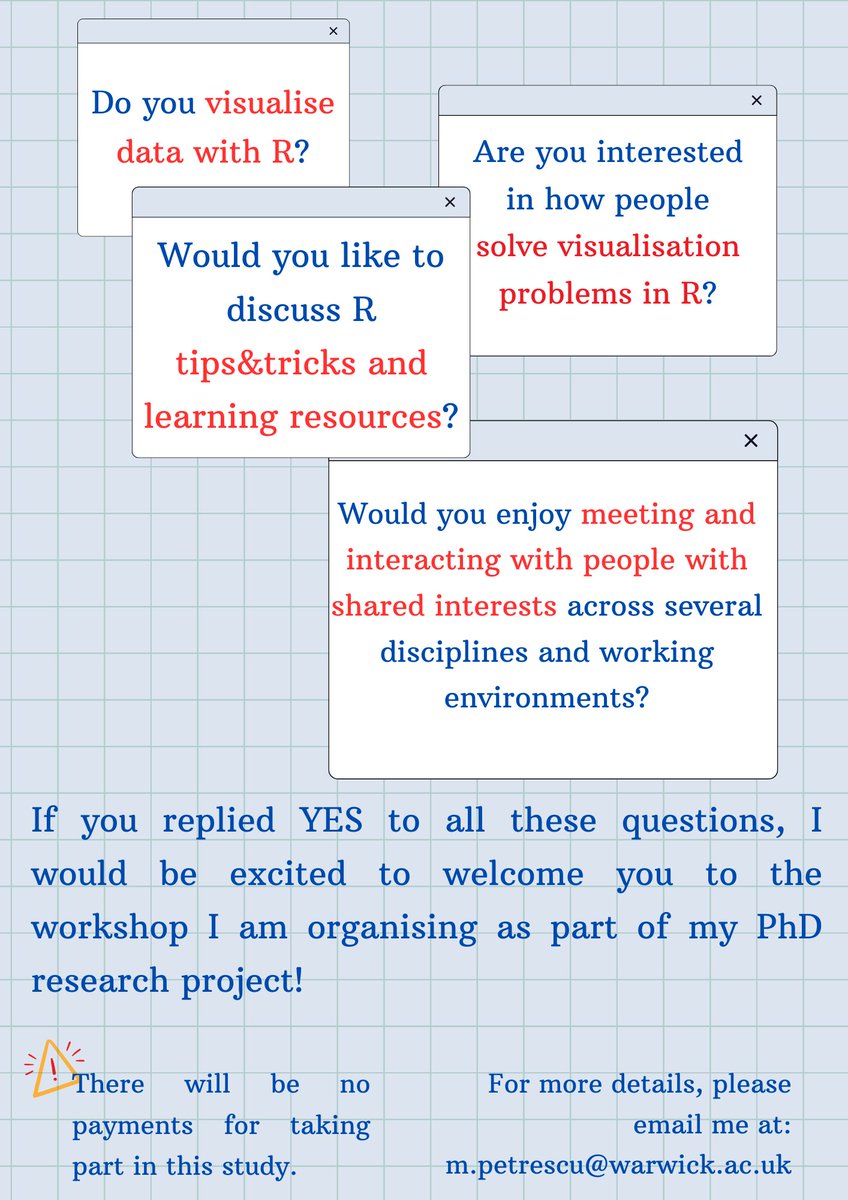
Looking for participants!
We’re running a user study to evaluate a prototype interface for discussing data visualizations. If you are interested in our work and want to support our research, join one of the sessions!
Registration: https://t.co/FHTqflaHDA
A very special vacancy @VU_IVM! 📢
We're looking for a data visualisation expert / science-artist for a (postdoc) researcher position in the @PerfectSTORM_VU project. https://t.co/Bba9j7jgO3
Your role would be to visualise drought-flood storylines in our cases & across the world.
We are #hiring. We are excited to say that we are starting a new phase of growth. As we plan for the future, we will be making multiple new appointments for an Assistant Professor/Associate Professor/Reader
+info: https://t.co/oJ42B2RKaH
This work was driven by my interest in the wider qualities and limitations of data, how they represent what they represent, and how they are then represented and made explorable in visualisations.
For more info and contact details please see here: https://t.co/b5a1QfghaW 4/4
I’ll be on the job market this fall and am interested in #postdoc and research positions around critical visualisation, critical data studies, and related areas. 1/4
With case studies on tree data and building age data, I explored how to surface and represent seams that remain hidden in seamless visualisations but can reflect underlying decisions, limitations, definitions, and assumptions in data and their visualisation. 3/4
#CityVis is back @ieeevis. This year we focus on the interplay between data visualization and data governance. More info and call for short papers: https://t.co/d8A8g4Cvfm