Excited to share my latest publication on Socio-ecological complexity in managing long-standing invasive water hyacinth in wetland agriculture and fisheries. 🪻
@ShamsGalib@MobassherH24348
https://t.co/vPuQ01psWW
New in Hydrobiologia: Existing open-access river barrier databases fall far short for #fisheries and #biodiversity management needs in south Asian transboundary rivers https://t.co/Nw3Iks427u https://t.co/9bGakJB8VP
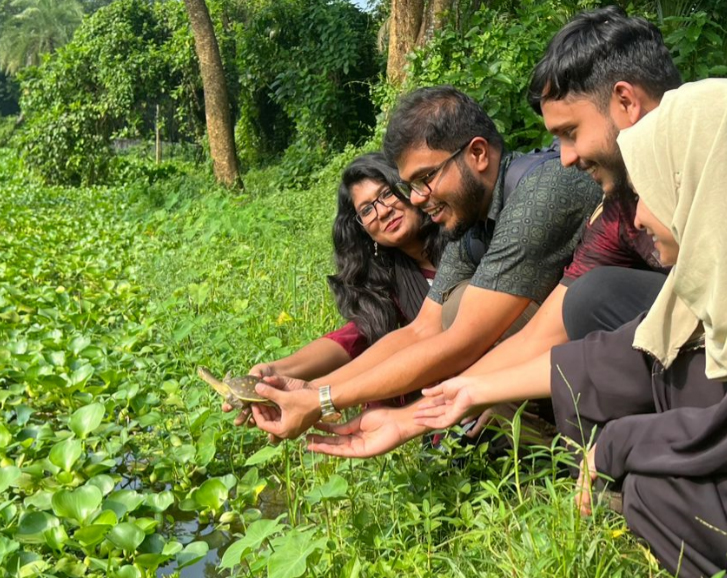
Meet Siri-a Lissemys punctata turtle rescued from illegal wildlife trade in Bangladesh by us. Once abundant, these vulnerable turtles are now rare due to overexploitation. After a safe rescue, Siri was released back into the wild #SaveChelonians#SaveWildlife
Effective data visualization is essential for statistical analysis and informed decision-making. That’s why my online course, Data Visualization in R Using ggplot2 & Friends, includes a dedicated section with 9 modules on specific plot types.
The violin plot is one of the plot types covered in this section. It serves as a powerful alternative to boxplots by combining summary statistics with kernel density estimates, offering a detailed view of data distributions. Violin plots are particularly useful for comparing groups and revealing patterns that simpler plots might overlook.
To give you a preview of the course, I’ve made the violin plot module available for free. This module includes a video lecture, a reproducible R script, several exercises with solutions, and many additional resources.
You can access the free module on violin plots here: https://t.co/hOlRRxByAw
Interested in exploring more advanced data visualization techniques with ggplot2 and its extensions in R? Check out my comprehensive online course!
For more information, visit this link: https://t.co/ztlEzoEDWv
#tidyverse #Rpackage #RStats #DataScience #DataVisualization
ggplot2 in R is one of the most powerful tools for data visualization, offering unparalleled flexibility and ease of use. Its functionality can be further expanded with a variety of extensions, making it suitable for everything from simple plots to complex, customized visualizations.
I've created a comprehensive online course, Data Visualization in R Using ggplot2 & Friends, which covers ggplot2 and its diverse extensions in detail. Whether you’re new to R and data visualization or looking for fresh ideas to improve your plots, this course will introduce you to techniques you likely haven’t encountered before.
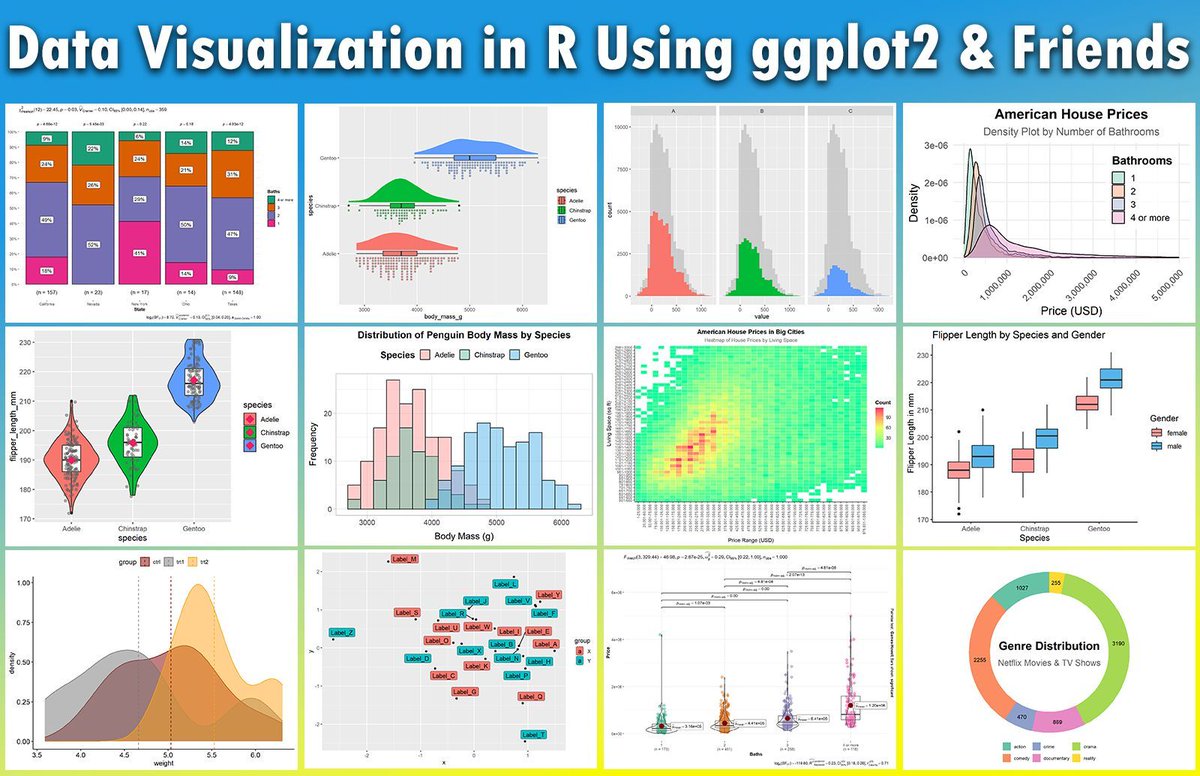
The visualization below shows a small sample of the plots we’ll create in the course. The course includes 28 modules covering basic ggplot2 principles, various plot types, and a wide range of ggplot2 extension packages to help you create visually appealing plots with ease.
More details are available at this link: https://t.co/ztlEzoEDWv
#programmer #DataVisualization #ggplot2 #DataAnalytics #Rpackage #RStats #tidyverse #datascienceenthusiast
Excited to share my latest publication on Conservation Challenges for Threatened Indian Flapshell Turtle Lissemys punctata (Lacépède, 1788) in the Largest Wetland of Bangladesh.
@ShamsGalib@MobassherH24348#Wetland#Conservation#ThreatenedSpecies
https://t.co/ogLVFlCEJ1
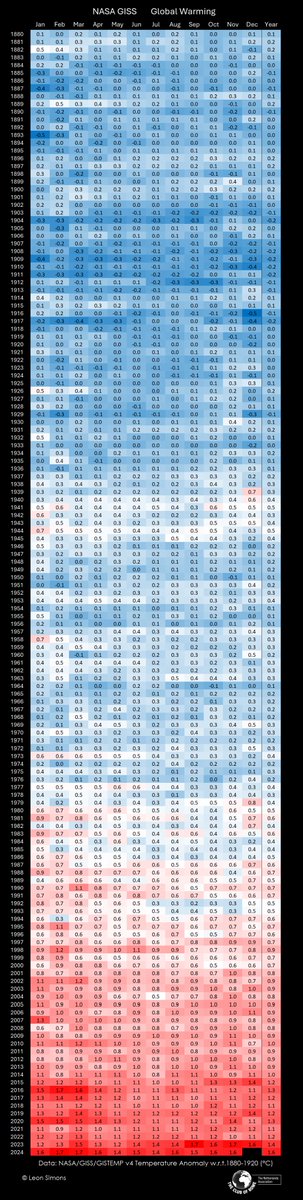
It's hard to know exactly how much we've warmed the planet today by looking at the climate of the past (e.g. 30 years).
There are more and more indications that future analyses will tell us that we are entering a >+1.5°C climate right about now.
According to the Arctic Report Card, the Arctic tundra has shifted from a carbon sink, which it has been for a millennia, into a carbon dioxide source, while also remaining a methane source.
More: https://t.co/HcdYwIDLkS
(2/8)
Ecological Niche Modeling Tutorial with R 🌍
Covers the basics with presence data cleaning, raster processing, variable selection, modeling and projection 👇
🔗 Online: https://t.co/4SaiU1siIh
📄 PDF: https://t.co/vrQ4opW1o2
#Ecology#Biodiversity#Modeling#OpenScience#GIS
Understanding stress responses is critical for conserving threatened species, yet directly studying such species can be challenging. This study of two 🐟 species presents a cautionary tale for studying surrogate species for conservation.
Read it here: https://t.co/5fsvNI1xoG
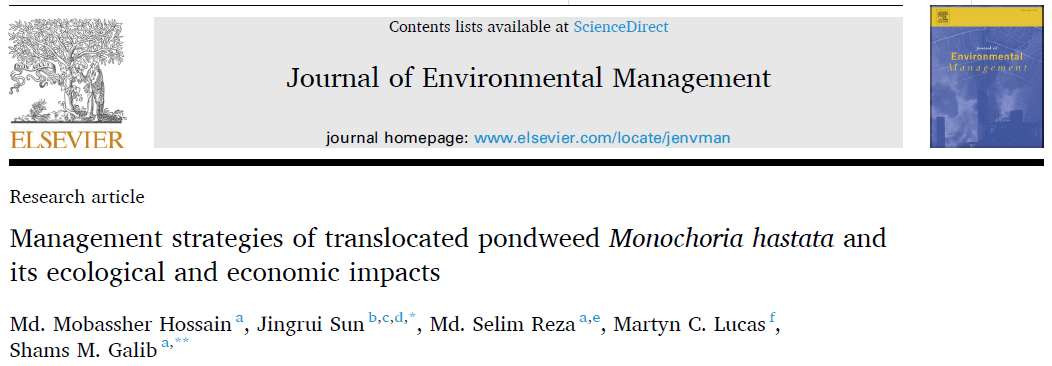
Now published in the Journal of Environmental Management! We evaluated, for the first time, the effects of the translocated pondweed Monochoria hastata on fish and rice production in two wetland habitats. @DurUni_Aqua_Lab@JingruiS@MobassherH24348
https://t.co/PDqdguMOO9