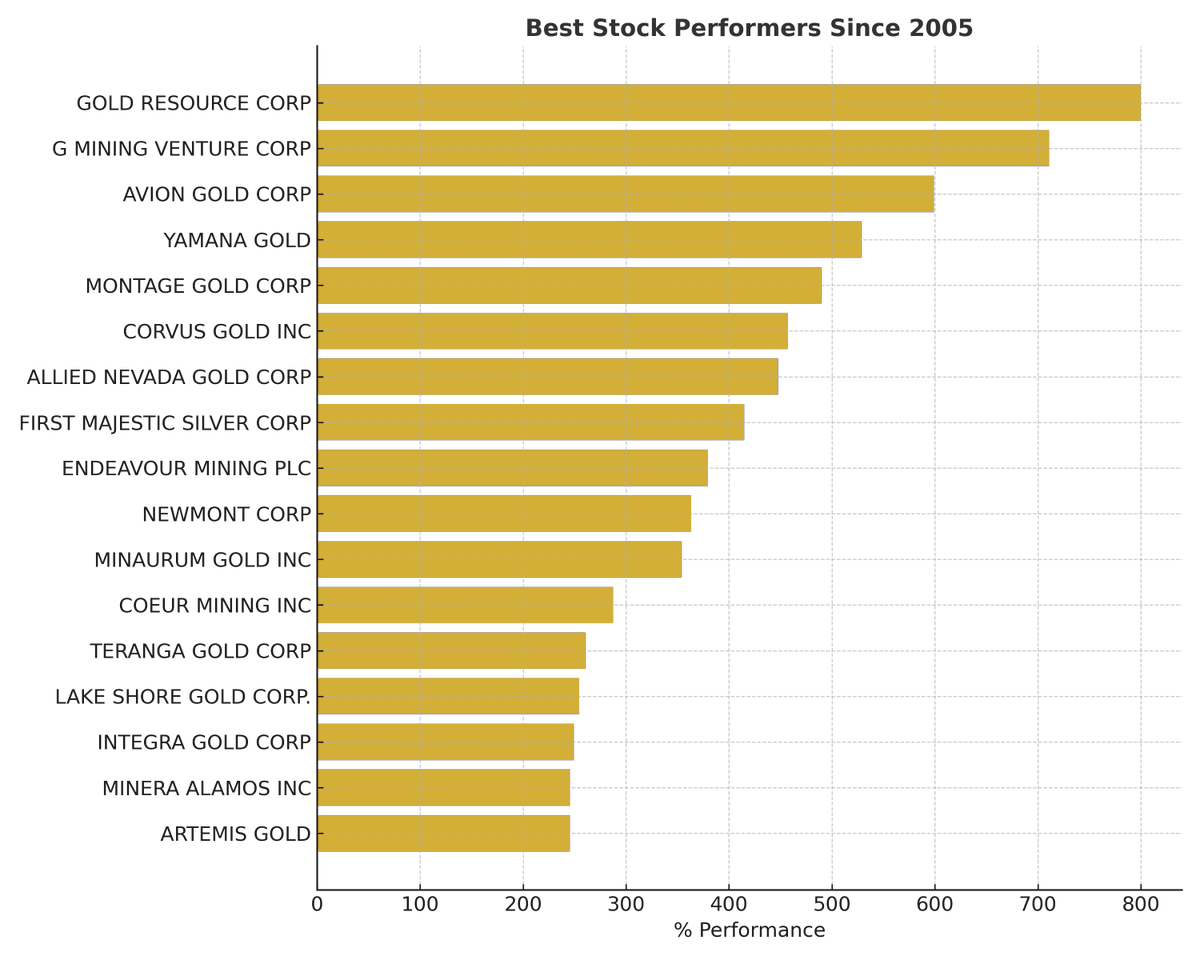
My strategy targets undervalued gold developers and producers with high upside potential. This list shows the biggest winners since 2005 that returned min 200%.
I went Long after a new Weekly Cycle in #Gold was partially confirmed at 4337 on 11th August. There is zero reason to doubt this bullish move in #PM's. However, I doubt fresh ATH's will be seen before the 1st quarter of next year.
@glucosegoddesss Thanks for the very insightful posts! Do you have any idea how long after a meal you can still get the metabolic benefits of walking? Is starting a walk 60–90 minutes after eating still effective?
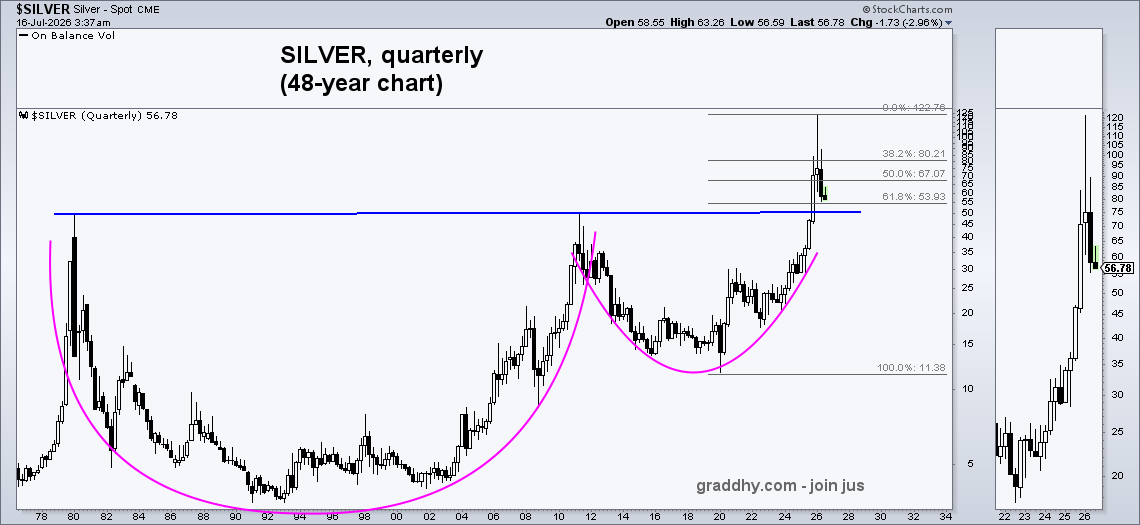
Silver is now down at one of the possible very big picture backtest support levels on the monthly time frame (see previous post just below).
Here is the possible support level on quarterly time frame.
@Oliver_MSA@ThHappyHawaiian Correction was supposed to be short-lived, just like in 2010. Back then, new highs were made after only 7/8 weeks. Clearly, that’s not happening this time. If silver manages to hold above the current level, forecast could still play out. Otherwise, it looks like a wrong call.
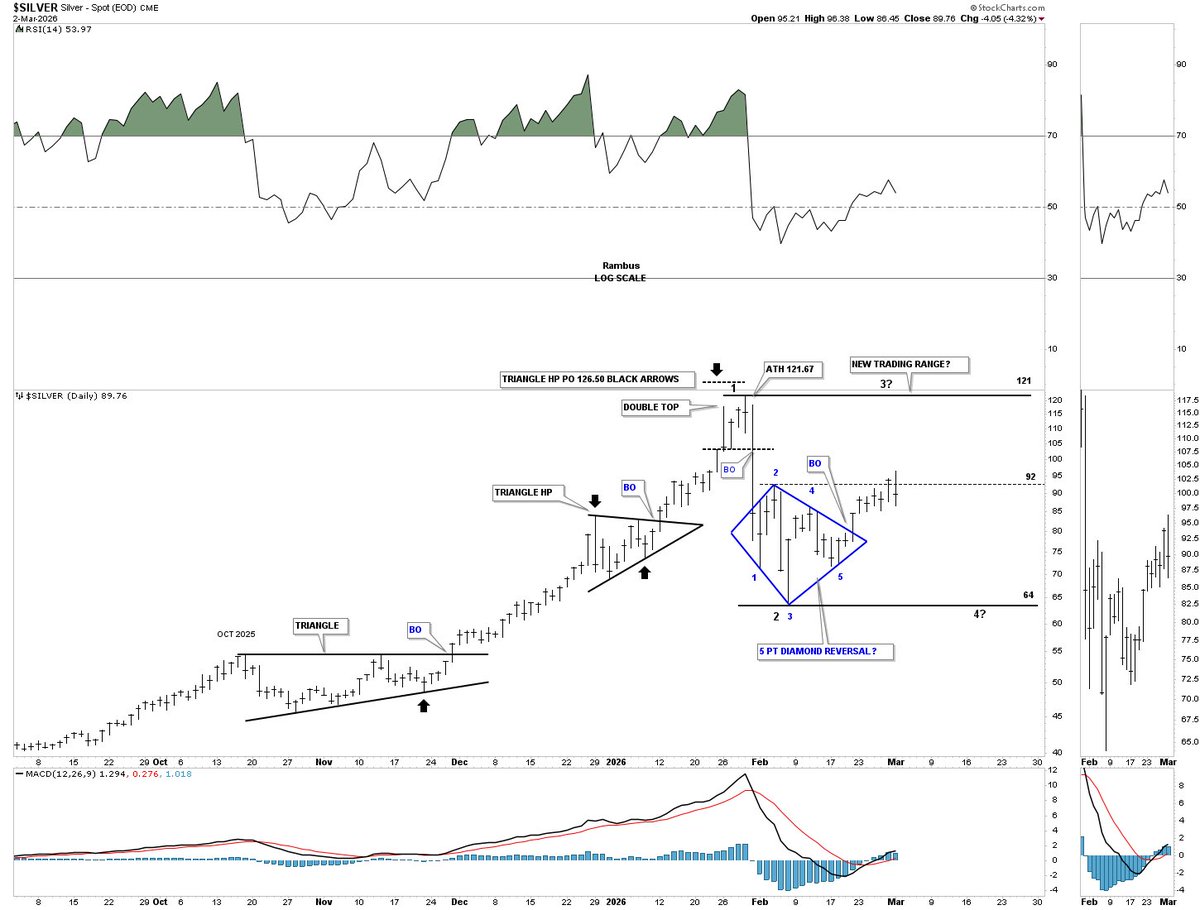
IS SILVER BEGINNING TO FORM A NEW CONSOLIDATION PATTERN?
After the massive rally of 150% since the late November low made last year to the January 29th all-time high at 121.67, some type of consolidation pattern seems appropriate. It took a massive amount of energy for a rally of that magnitude to take place. Emotions aside, silver needs to rest and consolidate its gains before the next major impulse move begins.
There was a measured move price objective which called for a high in silver around 126.50, which was a bit higher than the actual 121.67 high.
The new trading range is massive, with the high at 121 and the low at 64. A small double top reversal pattern formed at the all-time high, which led to the huge decline where the blue 5-point diamond reversal pattern formed at the low of the possible new trading range, leading to the current rally higher.
There are now two reversal points in the new trading range, with a third and fourth yet to form. It’s important at this point in a consolidation pattern that the price action keeps moving higher towards the top of the trading range to find the third reversal point high.
Consolidation patterns are no fun when they’re forming, but they are a necessary evil to keep a bull market healthy. All the best…Rambus
$SILVER
Thursday 🧵
You might think you’re late to the party.
Gold above 5,000. Silver pushing toward 90.
Miners and Juniors absolutely ripping.
But this bull market is still in its early innings.
In this thread, I’ll show you why.
Let’s go.
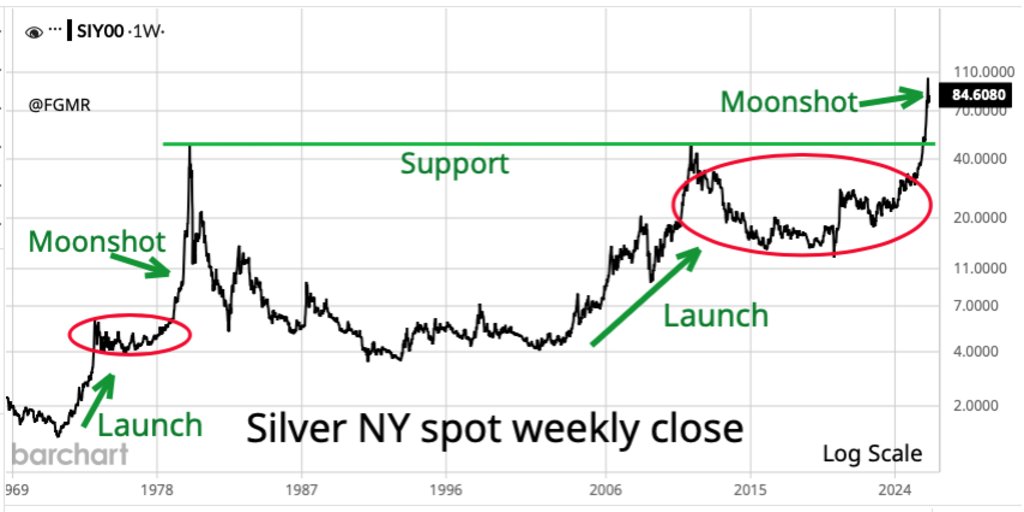
Last week #silver +9.3% #gold +1.3%. Ratio=60. Moonshot not over, but key week ahead with China coming back online. Need $5000 gold floor to hold. Silver floor (now $80) must keep rising, putting their ratio below 60 again. Same 2026 targets: $5833, $195 & 30:1 ratio.
https://t.co/aZQ1Pj6GpI
Near term moonshot target for silver is $148.
https://t.co/5yRjaZuTY3
It’s a #PreciousMetals bull market for physical metal & #miners.
SILVER’S SECULAR BULL MARKET PARALLEL UPTREND CHANNEL 📈
Now let's look at some long-term charts for silver, starting with this monthly chart, which shows silver's secular bull market uptrend channel. After the center dashed mid-line gave way, I put in a rough price objective up to the 145 area sometime in July of this year. As you can see, the recent all-time high came in at 121, just shy of the top trend line, with the blue circle showing how much the price action missed it by.
When we last looked at this chart a week or two ago, I mentioned that since the top trend line only has one touch point on it, the angle of the secular bull market uptrend channel could be off by a few degrees.
It's hard to ignore last month's large monthly reversal bar that came so close to the top trend line. All the best…Rambus
$SILVER
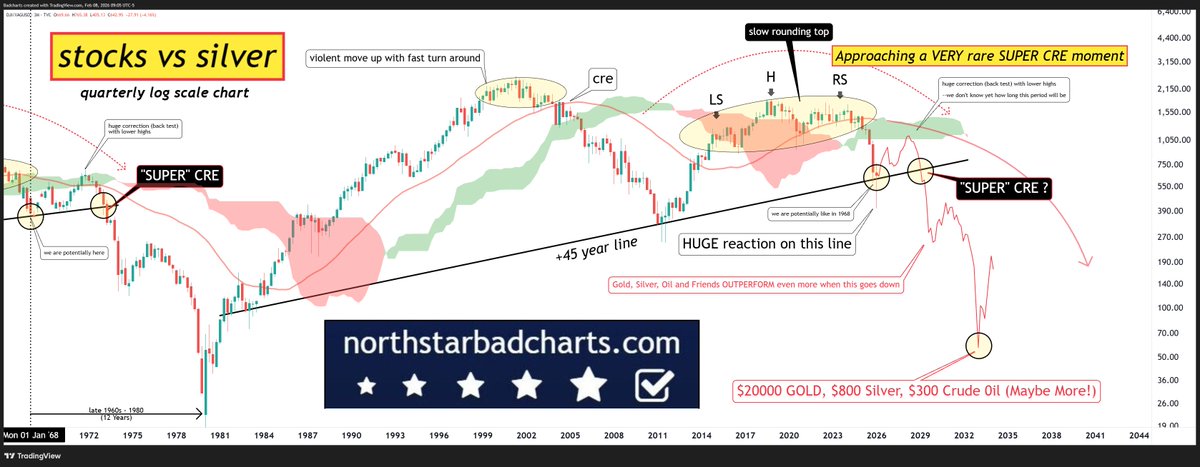
Roadmaps for $20000 Gold and $800 Silver.
HUGE reaction on that possible 45 year breakdown line for stocks vs silver.
If we get a bounce in Q2, it will OFFICIALLY morph into existence, making it a CRITICAL & VALID line.
BIG moves for Gold, Silver, Oil and friends below that.
📢 Physical Silver Market Update
Supply is tightening fast.
Perth Mint, Metalor: not accepting any new silver orders
Argor-Heraeus & Nadir: severe backlogs, delivery Apr–May
We're actively sourcing whatever silver remains available in the market. Wholesale premiums have spiked 100-200%. As a result, our retail premiums are being adjusted to match these new wholesale realities.
We are well stocked with silver because we ordered months ahead. Simple as that. Including 1 kg Perth Mint bars that are back in stock now.
@Menthalo1 Is there a meaningful difference compared with Western prices, or is this simply the COMEX price adjusted for China’s 13% VAT on silver?
Any idea whether the listed Shanghai prices are quoted inclusive or exclusive of VAT? Thx.
@Menthalo1 Why would that be important? It just allows Indians to use silver as collateral for loans, providing households with a new source of liquidity, offering a 75% LTV ratio, rather than forcing them to liquidate or accumulate silver. No clear relationship with gold silver ratio.
🚨You’re going to want to save this chart $USD 💵🇺🇸
US DOLLAR THE MOST IMPORTANT CHART ON THE PLANET FOR THE PM COMPLEX: Since the parabolic rise into the 2022 top, low for the precious metals complex, the US dollar began a new leg down.
After the initial decline, the price action formed the two-year black bearish expanding rising wedge, which broke out to the downside in early 2025.
Since mid-summer last year, the US dollar has been building the blue bearish expanding rising wedge as the backtest. Note the internal structure of the blue bearish expanding rising wedge, which formed a H&S, strongly suggesting the pattern was completing and the breakout was eminent.
The same pattern from a bar chart perspective will show a rectangle consolidation pattern that hasn't quite broken down yet.
The next leg down for the US dollar has begun, which should benefit the precious metals complex. All the best…Rambus
In July, I warned about the exact moment for the VERTICAL move in silver. Despite the insane RSI values, I noted that silver gave an [outright buy] signal in early December. Turning $72 into support indicated that silver was [strong]. Since then, silver has exploded and blasted through every level I shared.
The perpetual top callers have been looking at this market through the lens of a useless indicator (RSI). These lazy students fail to understand that when a commodity breaks out of a 45-year-old top, it is normal for that market to go 2x, 3x, 4x, and disregard the RSI or the Bollinger bands. Gary understands this. He likes to climb steep mountains, so it is easier for him to call big numbers. I prefer to take it step by step.
- will silver go much higher in the following months? Most likely yes
- will silver hit $300 this year? I don't know.
SLV's Bullish Rising Wedge: Breakout & Momentum Building! 🐂🚀
SLV'S OCTOBER 2025 BULLISH RISING WEDGE. Last October, SLV began to form its 6-point bullish rising wedge, which is the dominant chart pattern in the precious metals complex right now.
The breakout came on January 12th with a breakout gap. The backtest to the top trend line formed the smaller blue bullish rising wedge, which shows a breakout gap last Friday with more follow-through to the upside today. 📈
SLV is currently trading above the upper channel of the Bollinger Bands and may need a pause to refresh. ⏸️
There are many individual precious metal stocks that are impulsing higher after breaking out from their respective bullish rising wedges. All the best…Rambus
$SLV
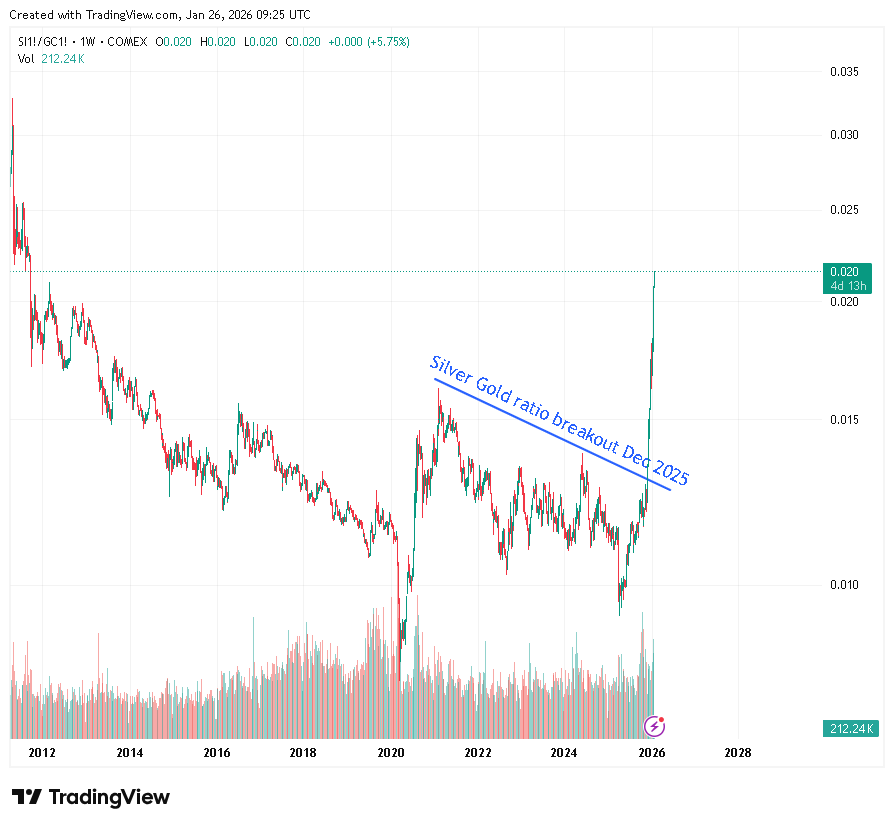
Looking at the #Silver $SLV price chart suggests the rally may already be mature. However, the silver–gold ratio tells a different story, indicating that the current rally is likely only about two months old, with potentially at least five more months remaining.
#gold something to watch for, if we look at chart #gold rally from 2800$ to 3500$ before a relief correction around 11%
then rallied to 4400$ (around 24% after breaking the highs) before a relief correction around 11%.
what we can conclude ?
price repeating the same action where i think if its true we are heading to 5400-5500$ then a relief correction b/w 10-15%.
#gold #silver
From Explorer to Producer: @VizslaSilver ( $VZLA) is gearing up for a massive 2026!
Listen here: https://t.co/WXswLsc0UX
CEO @KonnertM joins @TheKEReport to discuss:
✅ A fully funded path to construction ($400M+ cash)
✅ 60,000m drill program for resource growth
✅ The "billion-ounce district" vision
✅ Permitting catalysts ahead
#Silver #Mining #Stocks #VZLA #Gold #Investing #Mexico #Commodities
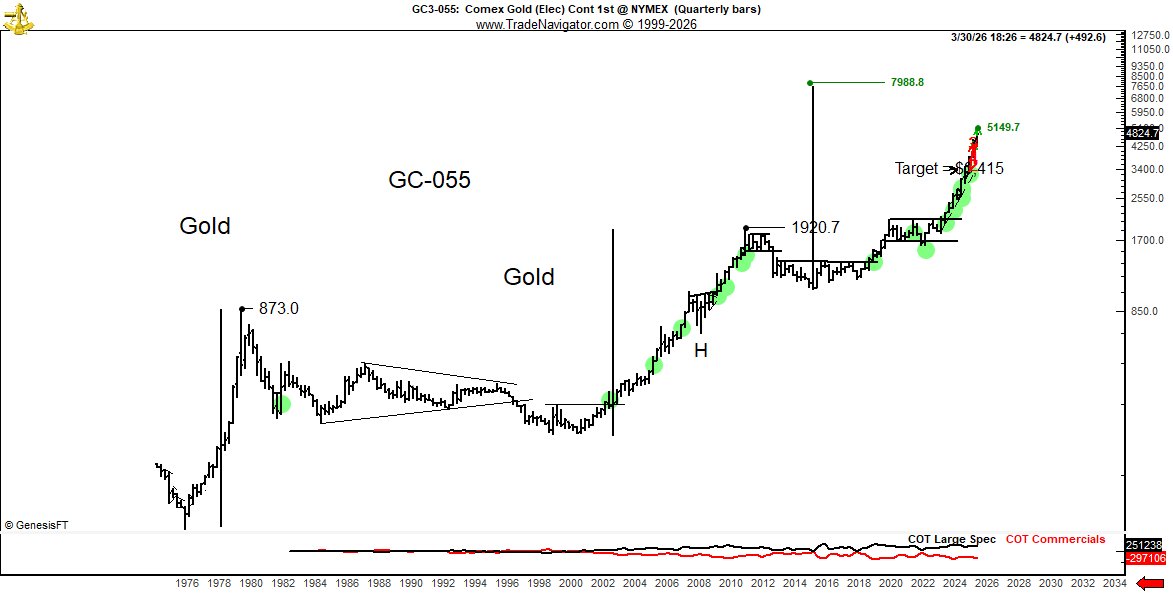
If current bull cycle in Gold is similar in scope to previous bull cycles, then $8,000 is in the cards
For all the grief given to @PeterSchiff especially by the cryptocultists, he is having the last laugh $GC_F #GOLD