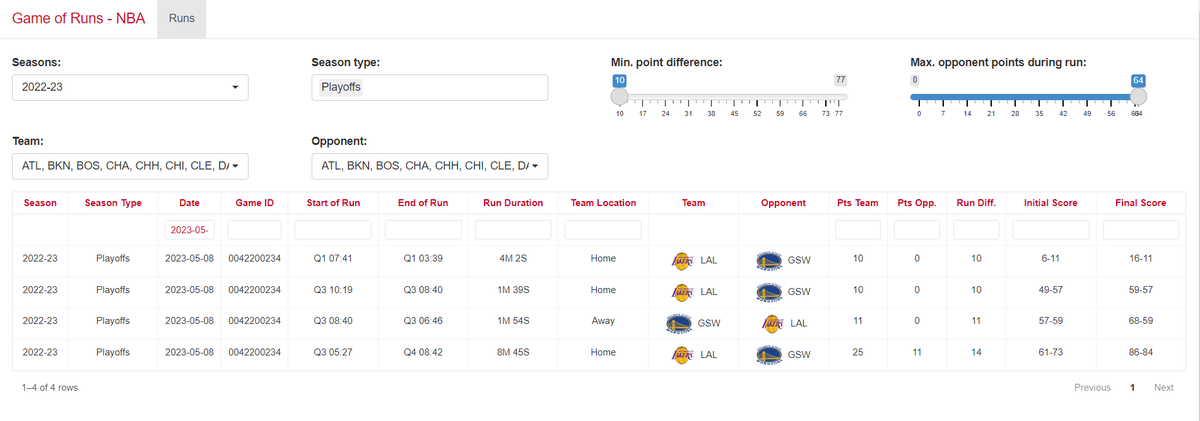
🚨 New NBA tool: inspired by @MoDakhil_NBA's rant in a recent Nerder She Wrote podcast, I created an app to track scoring runs during NBA games, going back to the start of the pbp era. This is still an initial version so every feedback is welcome:
https://t.co/x7gRXjLdnd
Personal news: I'm looking for job opportunities.
Resume: MBA (UMia), #rstats, passion for working w/ data (especially "boring" parts - cleaning, manipulation, quality control).
Would love something NBA-related but open to anything, incl. contractor (must be remote). DMs open.
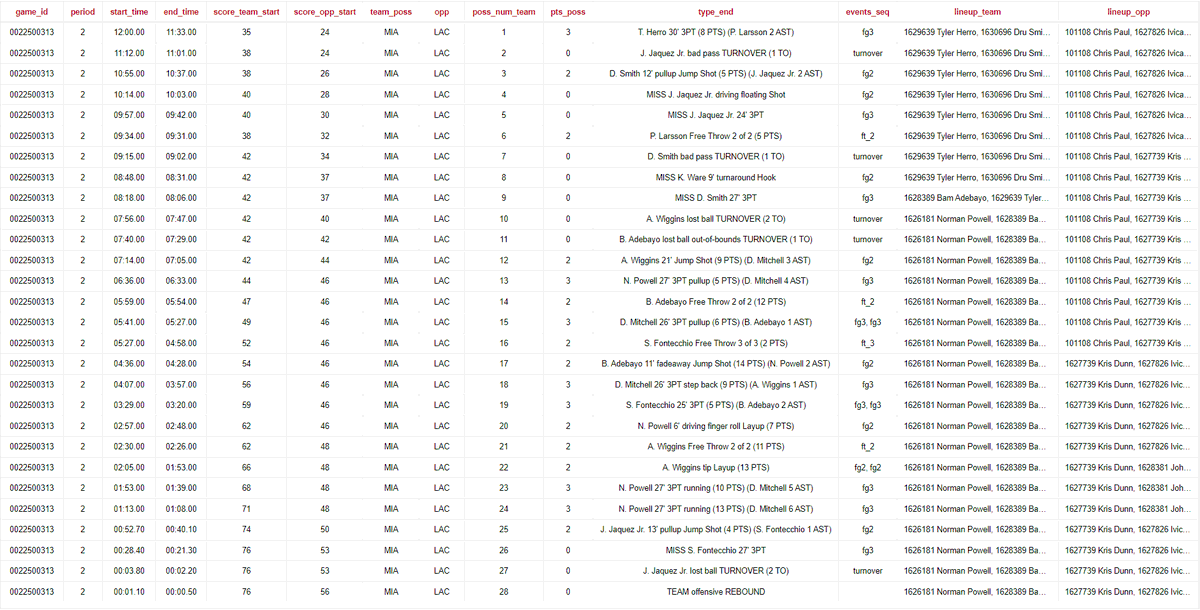
Play-by-play, lineup stints and possession-level data for the 2025-26 NBA season are now available on my repository (link below). Here's every Heat possession in the 2nd qtr of last night's game against the Clippers, where Miami scored on 14 straight possessions, a season record.
It took the Timberwolves 7:04 minutes to score a point in last night's game against the Cavaliers. That's the 5th longest drought to start a game in the play-by-play era, and longest since 2015.
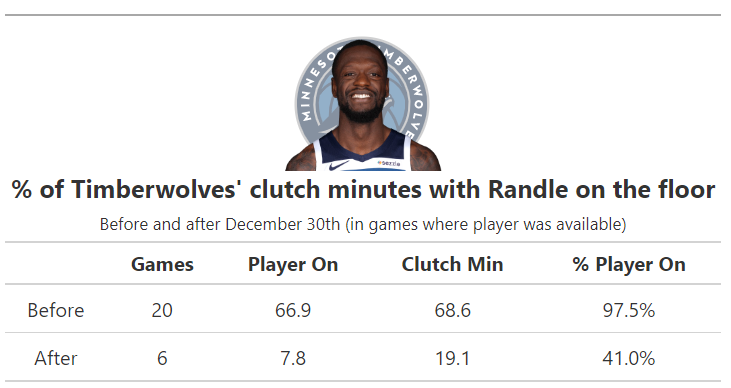
Before December 30th, Julius Randle was on the court for 97.5% of Minnesota's 68.6 clutch minutes over 20 games. Since then, he's been on the court for 41% of the team's 19.1 clutch minutes over 6 games. #rstats
Bad vibes from Julius Randle, who has been increasingly benched during clutch time in Minnesota. Left before the final buzzer on national TV on Wed.
On the latest @KevinOConnorNBA Show:
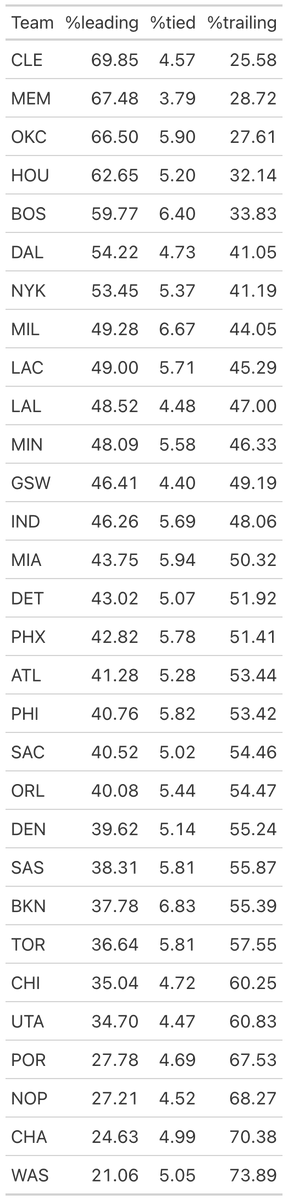
% of Offensive Possessions played starting with the lead, tied and trailing. We will be adding this to the @The_BBall_Index site
Big hat tip to @NbaInRstats
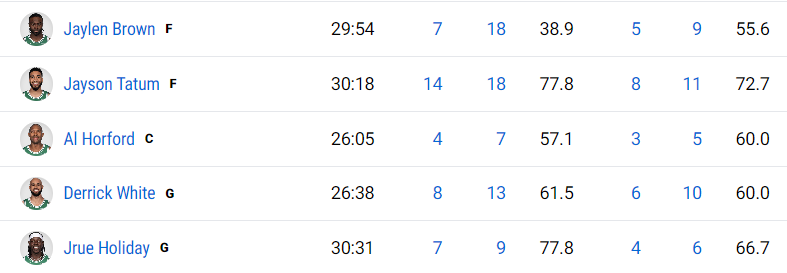
Number of times in NBA history where all the 5 starters of a team made 3+ three-pointers while shooting over 50% from 3 in the same game:
1.
The Boston Celtics last night.
#rstats code: https://t.co/Jf2QZeBaJZ
Guide to Sports Analytics (v5)
The latest version of the guide is here and it now totals over 1,000 resources covering R, Python, SQL and more. New accounts to follow, tutorials and blogs along with a new “how to get started” and “articles” tab !! ⬇️
https://t.co/ZeFuzwVPmY
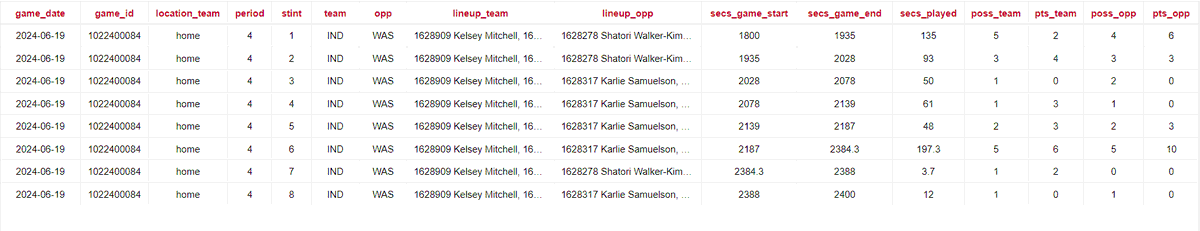
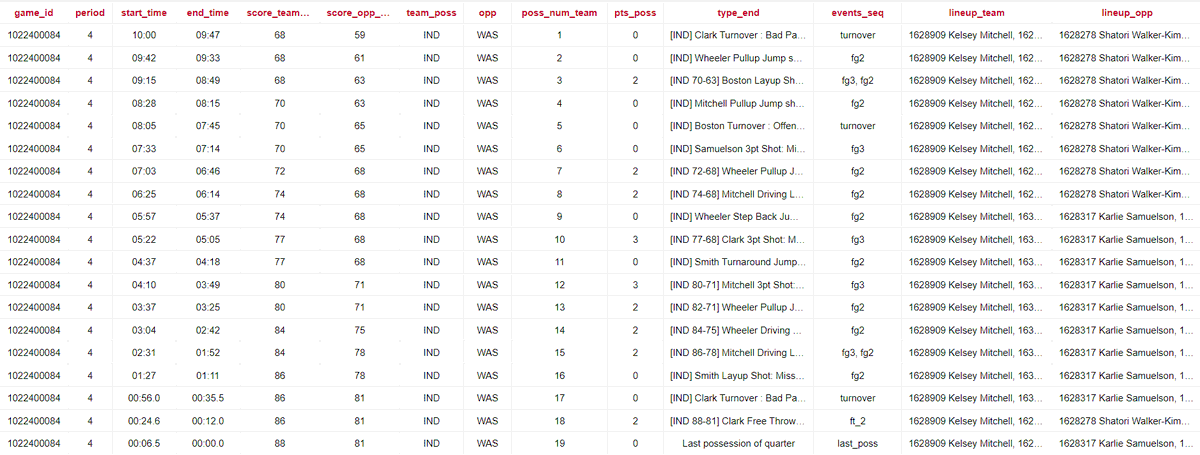
Play-by-play, lineup stints and possession-level data for the current WNBA season: https://t.co/0tkLa0wrIW. Here are the stats for every lineup stint and details for every possession of the Indiana Fever in the 4th quarter of their most recent game against the Washington Mystics.
@SethPartnow@DaveDuFourNBA@MoDakhil_NBA I’ll miss listening to you guys if this is it. Always looked forward to listening to Nerder when the episodes came out
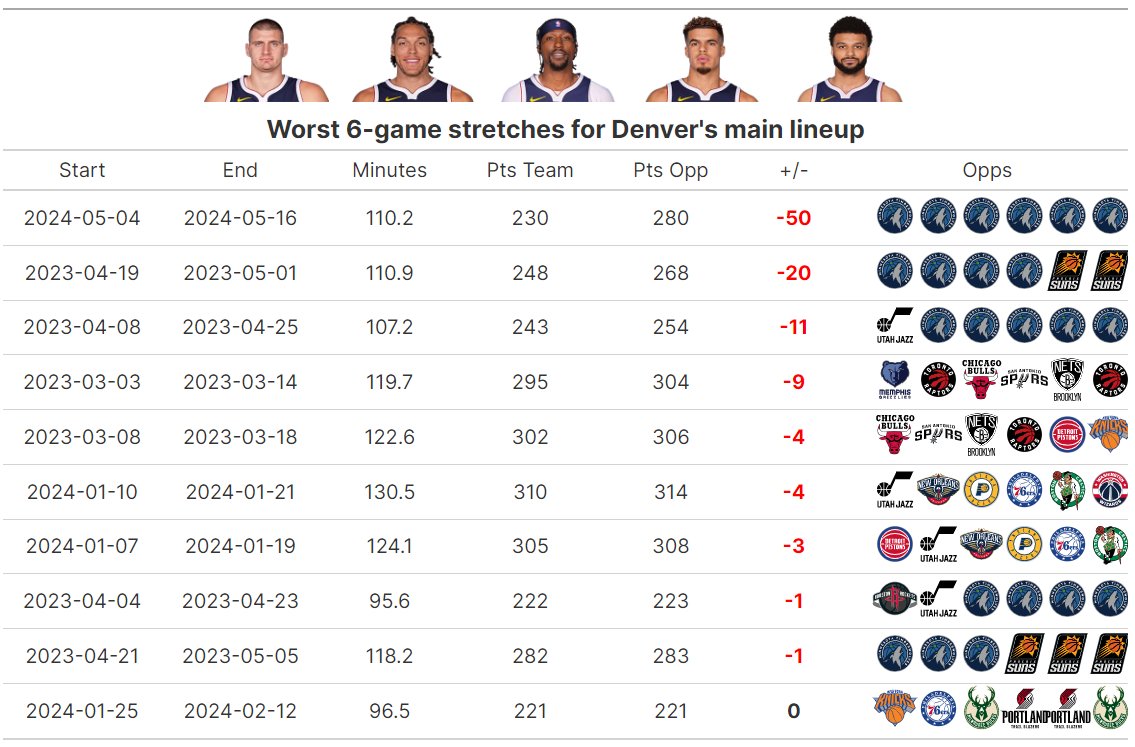
A couple graphs to illustrate this:
1- Before this series against the Wolves, the worst 6-game stretch for the Nuggets starting 5 in total +/- was -20.
2- The lineup was at least +14 in every playoffs series vs other opponents, but -1 and -50 in series vs Minnesota.
#rstats
Denver starting 5 is now minus-50 in 110 minutes in this series. Even if you posited some injury issues and weird blowouts, I'm not sure I would have conceived of that as possible in any series.
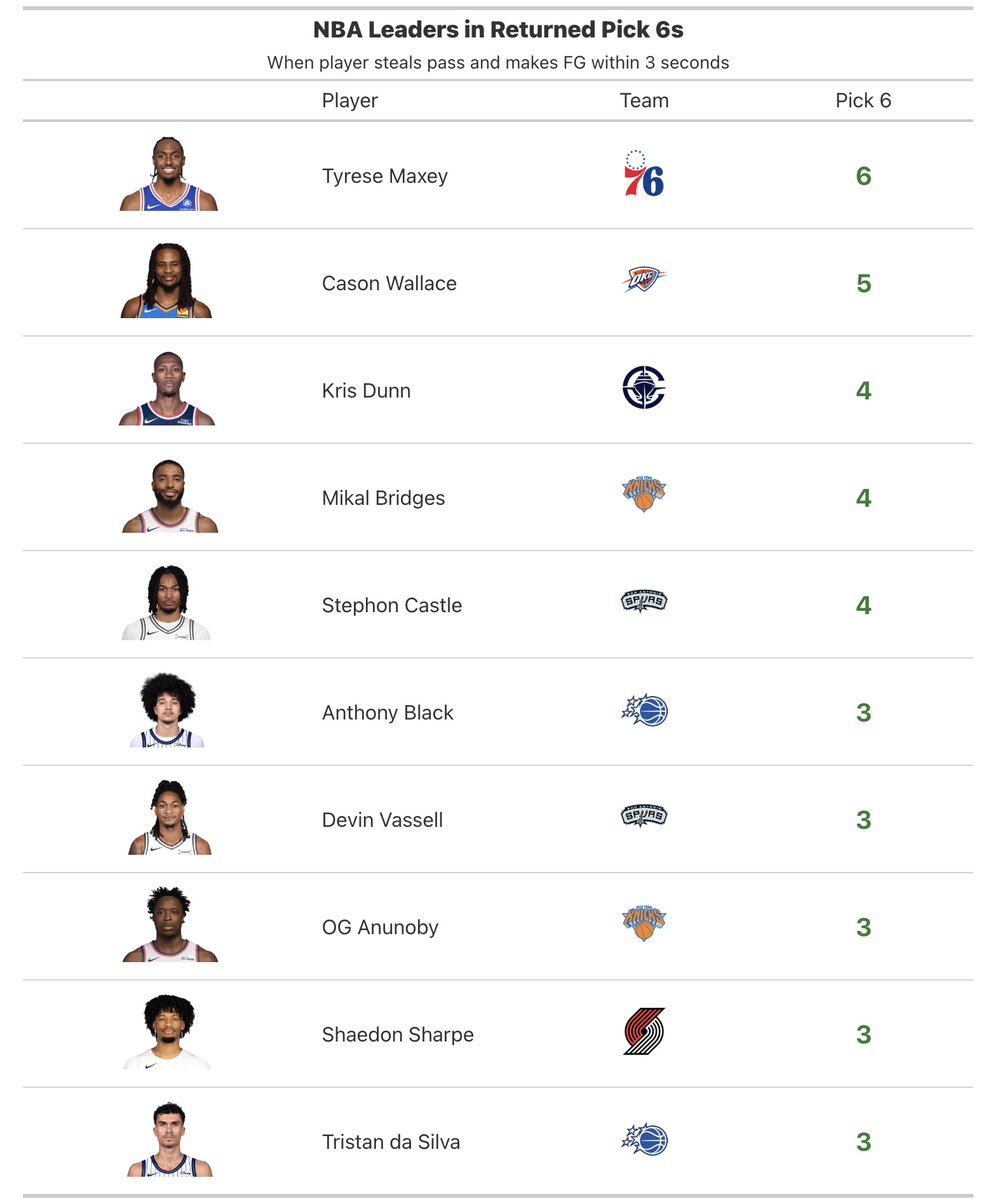
@TheExiaRoss00 I don't think so, at least not with public data. The play-by-play only has the passer for made field goals, so it wouldn't be possible to find the FG%. Would be very interesting though if there's a way to find this with other data sources.