$VELO | @veloprotocol
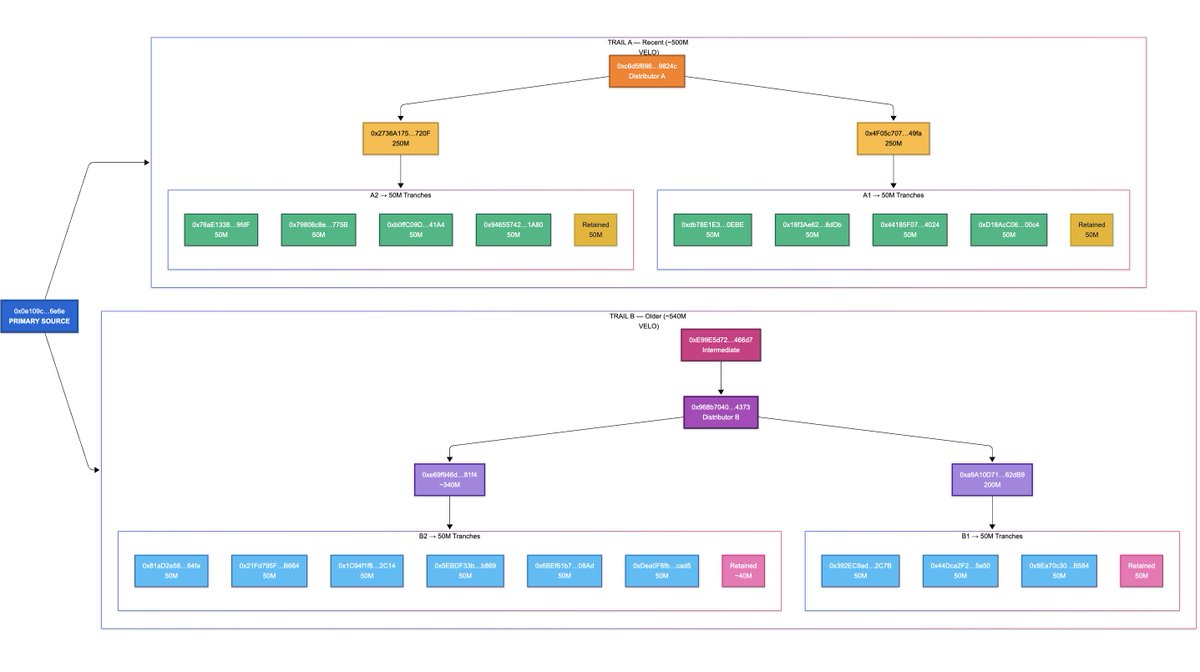
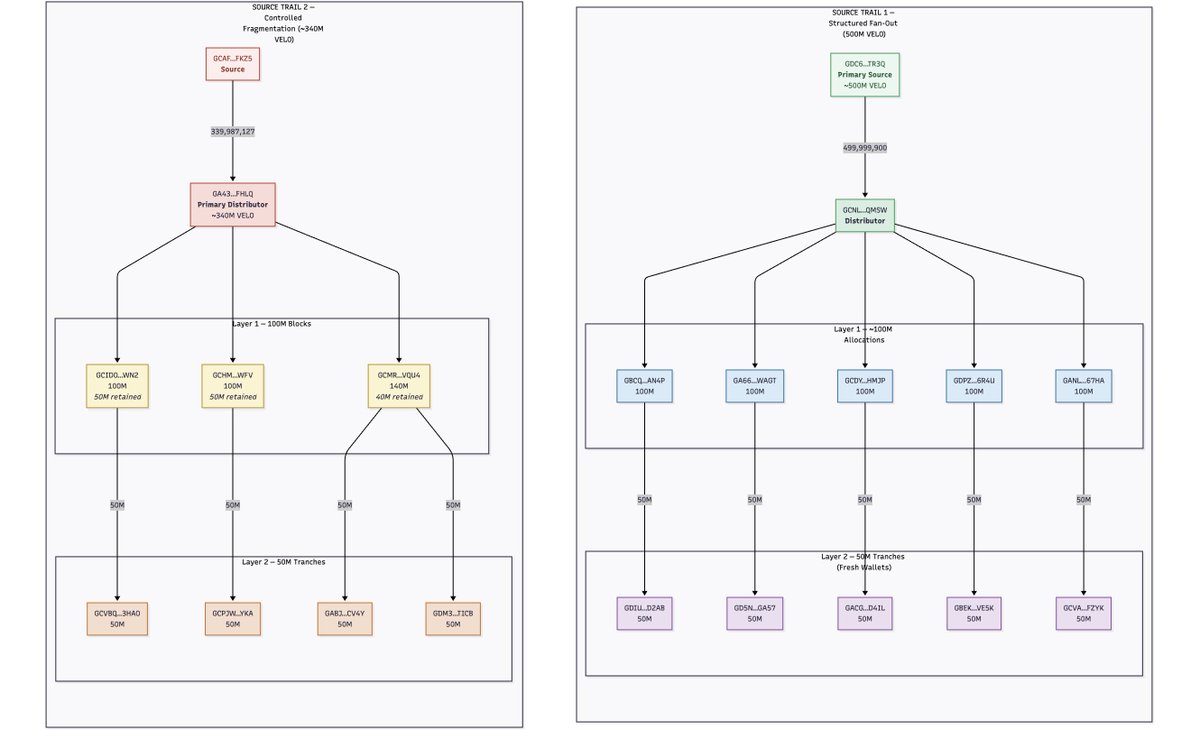
Observed Controlled supply fragmentation via tranche fan-out.
Primary source wallets fragmented large balances into uniform 50M VELO tranches across fresh wallets, via controlled distributor paths (Stellar ↔ BSC, 1:1 supply).
This is best described as structured, tranche-based wallet fan-out.
Charts below. DYOR.
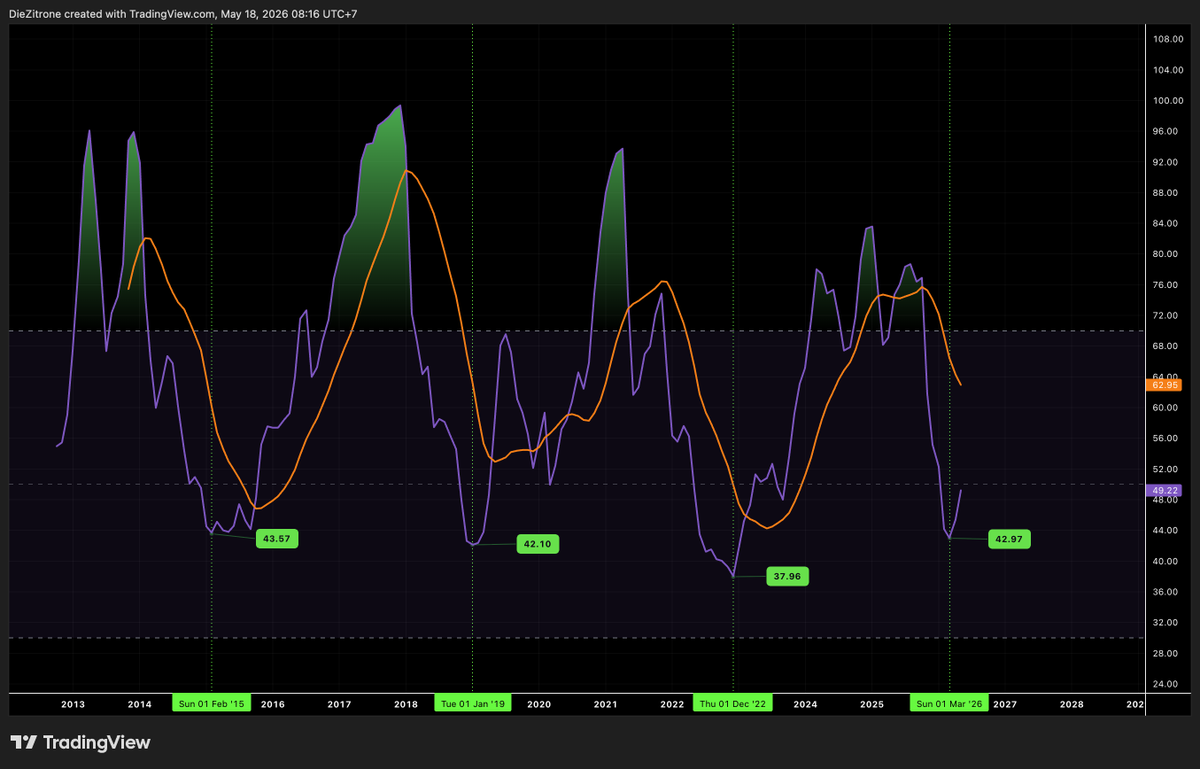
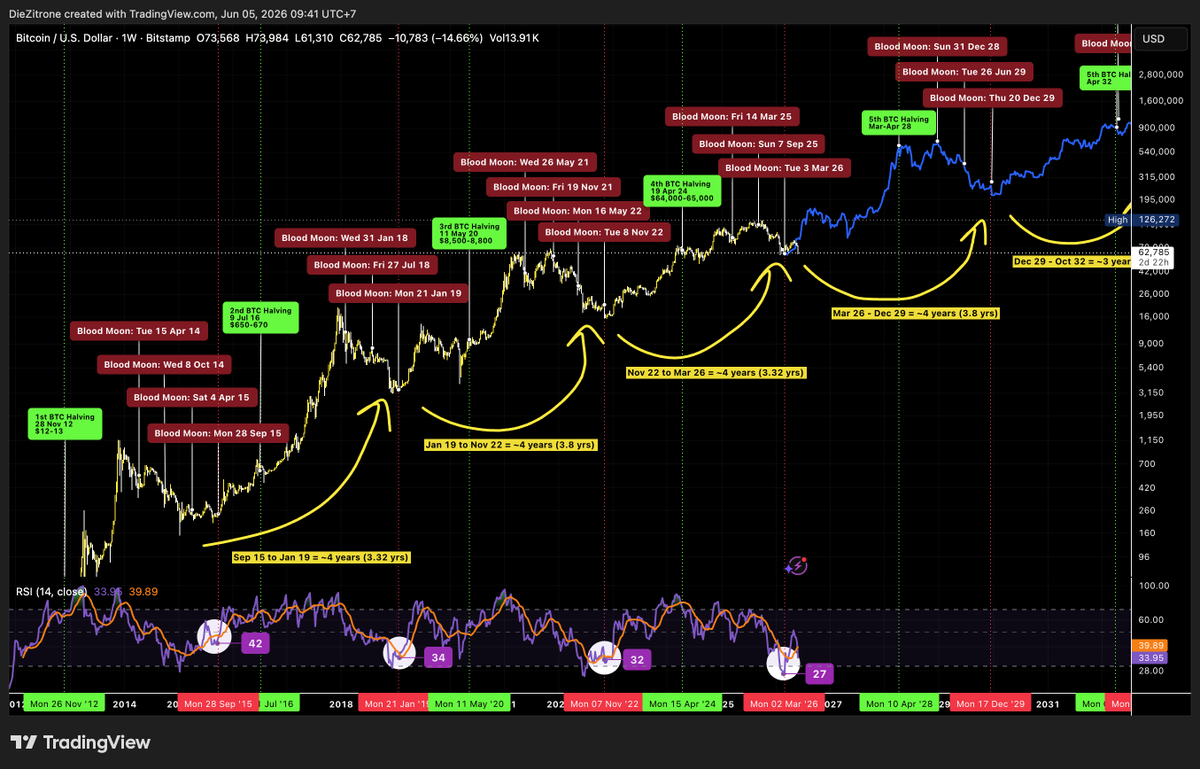
$BTC Cycle Analysis (Weekly Chart) based on 🌒 Blood Moons + $BTC Halving Dates + Weekly RSI on Blood Moons 🌒
Blood Moons have been marking major cycle bottoms for over a decade (between 2012 and now)
Every major BTC bottom has formed between the last Blood Moon of one cycle and the next as shown on this chart.
Halving + Blood Moon 🌒 Rhythm
------------------------------------
1⃣ Halving (2012) > bottom near 2015 Blood Moons
2⃣ Halving (2016) > bottom near 2018-19 Blood Moons
3⃣ Halving (2020) > bottom exactly on Nov 2022 Blood Moon
4⃣ Halving (2024) > we’re now inside the 2025-2026 Blood Moon window
Cycle Timeframes (Low to Low)
---------------------------------
~3.3 – 3.8 years (very consistent)
Weekly RSI at Cycle Bottoms
-------------------------------
2015 > 42
2018 > 34
2022 > 32
Current (2026) > 27 = most oversold ever
We’re sitting at the lowest weekly RSI in Bitcoin’s history, right in the middle of the Blood Moon cycle window, exactly where every previous bottom has formed.
My analysis is based purely on the observed pattern between Blood Moon dates, Bitcoin halvings, and weekly RSI levels. I could be wrong, but I just wanted to share what I’m seeing on the chart.
$VELO l @veloprotocol
Inverted Monthly Chart Update
Price is currently consolidating in the range of $0.003–$0.005 since Feb (orange box)
Still waiting for price to break out of this consolidating phase -- to the downside of the chart at least to the both green boxes.
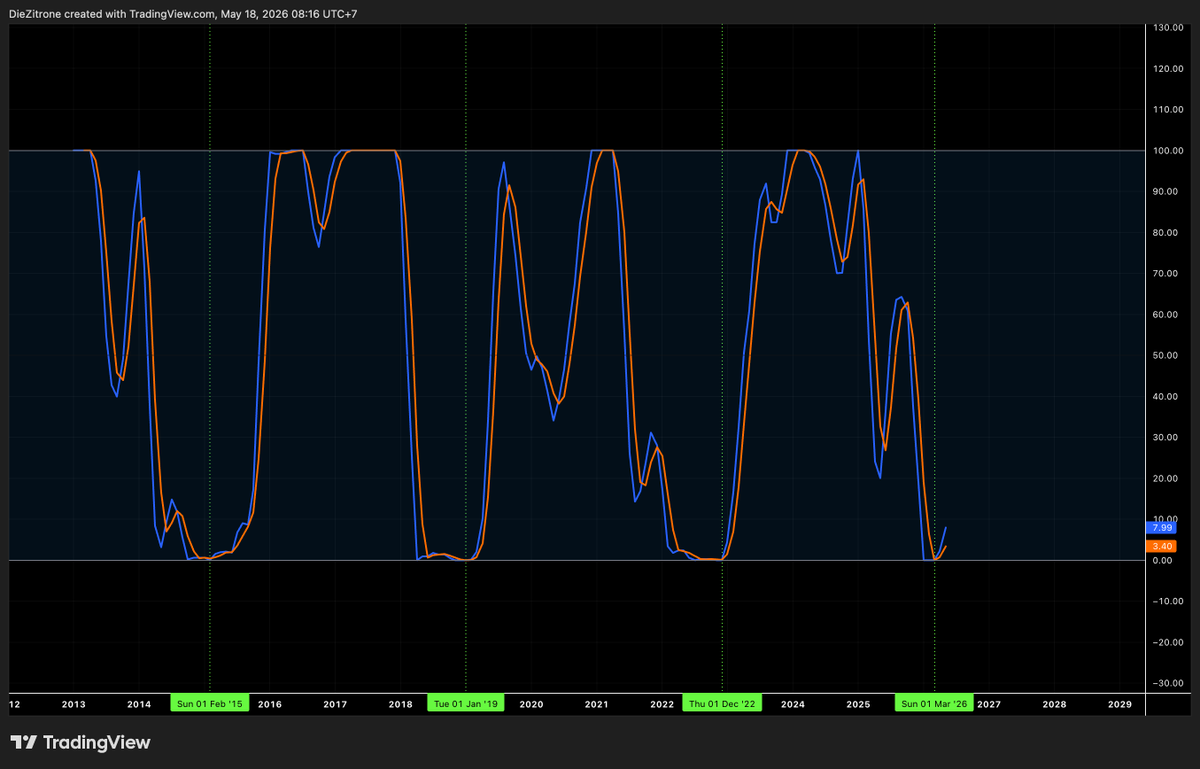
$BTC
I'm still waiting for the PIVOT signal on Point 3⃣
3⃣ In the current cycle, as of March 2026
The monthly RSI has reached 48-49 now. However, the RSI Div. indicator has not yet showed a Pivot signal but bullish crossover on Stoch RSI has already occurred.
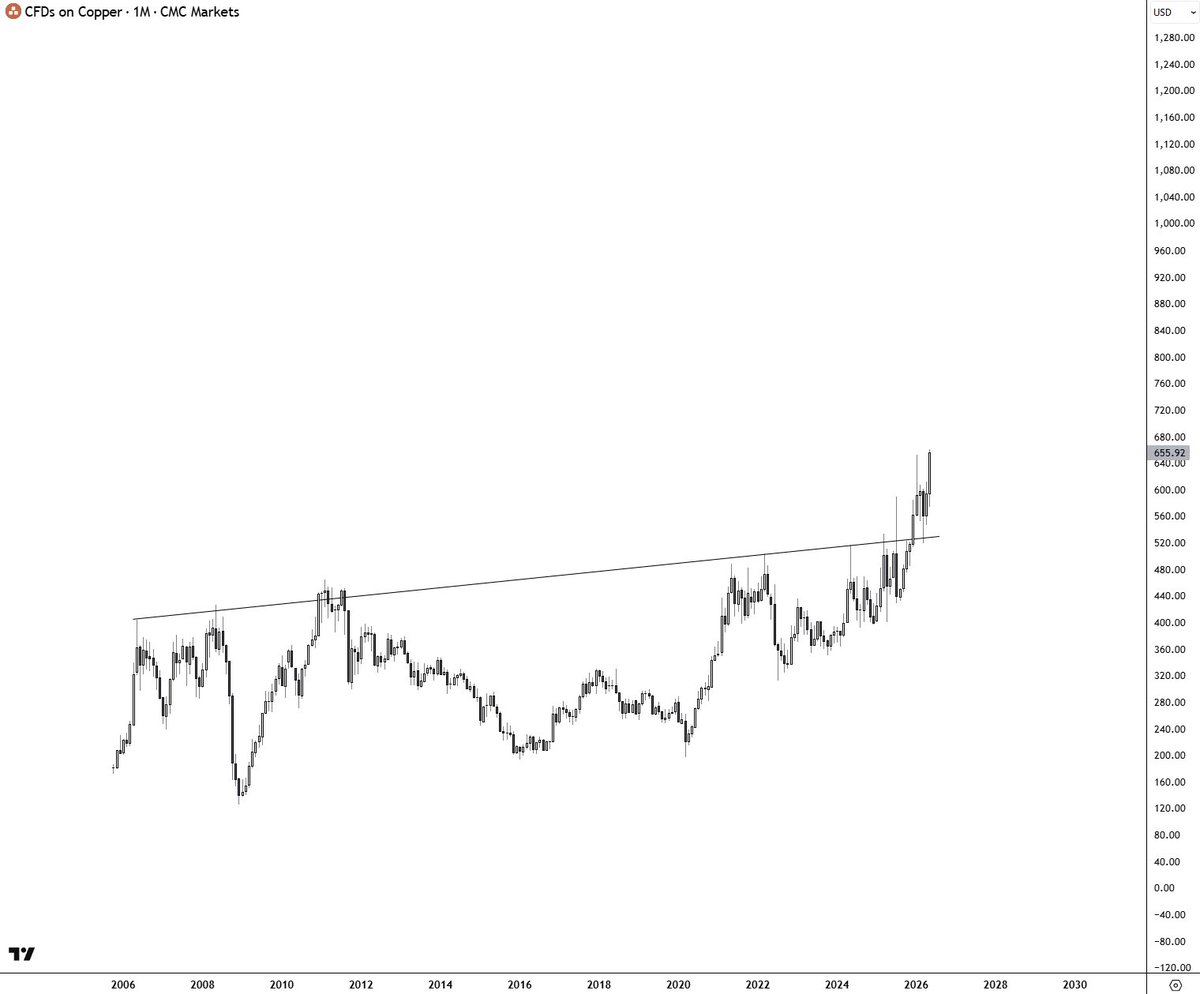
One of the best risk-on signals is $Copper leading & outperforming
It has just broken out of a two decade long channel/range, successfully retested it & now hitting new ATHs
It has also been outperforming $Gold too for 3 months straight
Historically, this has caused bull runs in crypto and both $BTC & $ETH did thousands of precent during those times
Why fade this? Ego?
Altcoins are ready.
For the first time in a long while, they are ready to move.
A few month ago I posted about this setup, and how where we are is much more like 2019/2020 than 2022, and now it is playing out.
There has been several high level data points that I have shared over the months that have shown this, but as usual, the crowd chants "alts are dead".
But now we have confirmation they are not dead.
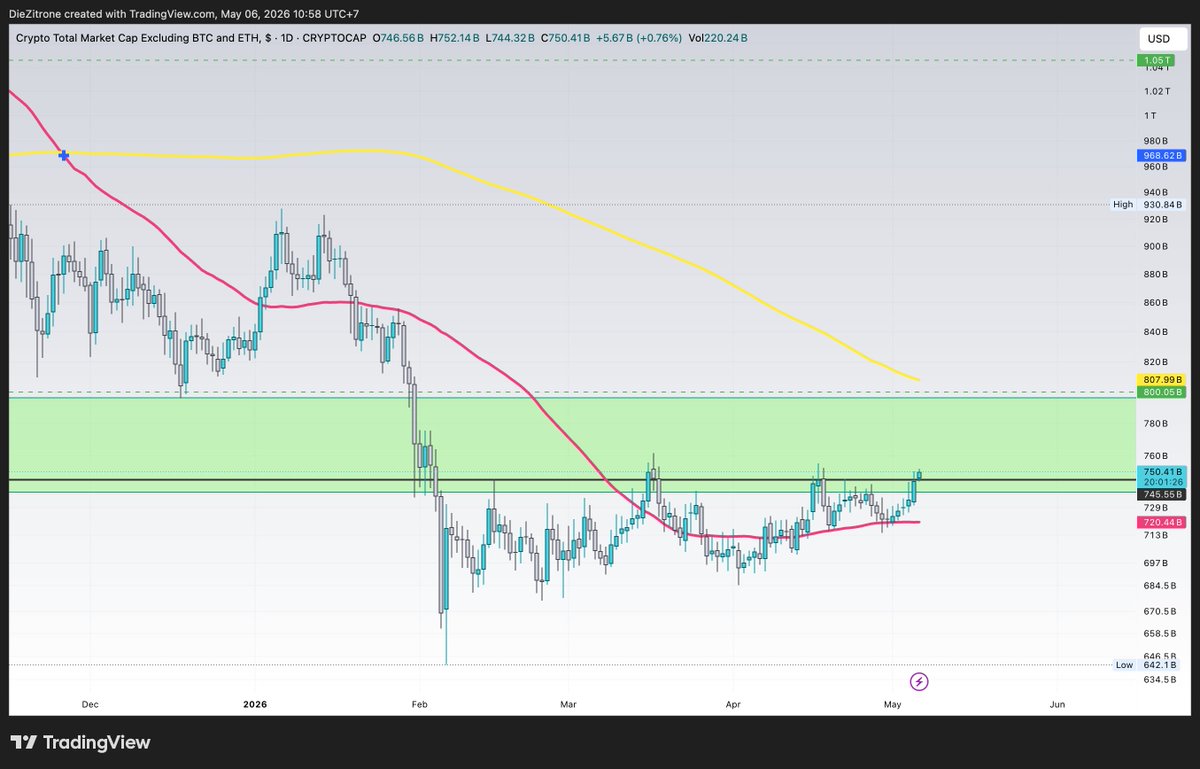
OTHERS, along will all other Altcoin index's, has just been trading in one large range for several years.
This is because, as shown in many other ways, we have only been part way through the cycle.
This is not a new cycle starting here... we have simply just completed a mid cycle correction.
OTHERS has now confirmed its deviation below the range, just like it did at the highs...
And is putting in a strong candle here, showing us that its moving back into the range with strength.
Both MACD and RSI confirming, along with PMI and liquidity.
It's time.
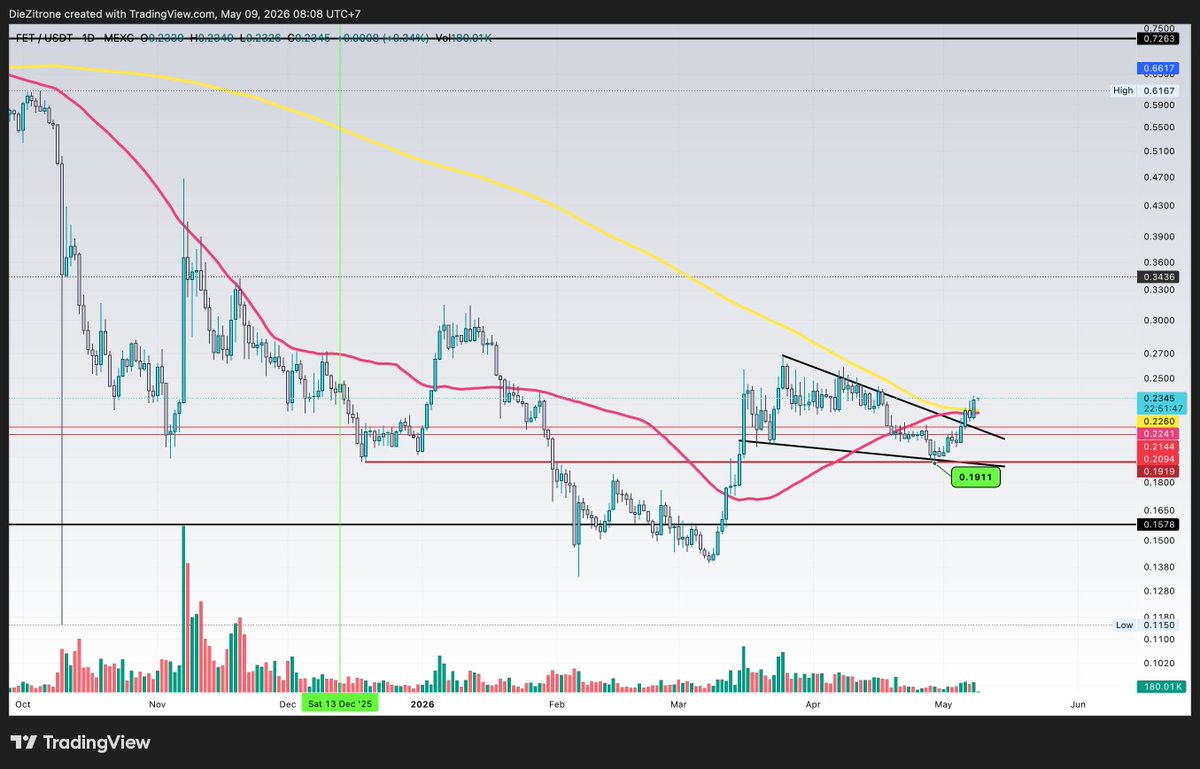
$FET l @Fetch_ai
Price has broken above the upper resistance trendline of the falling wedge pattern on the 12H chart.
Plus, the daily RSI is bullish at ~61 and the MACD is showing strong bullish momentum. A golden cross on the daily timeframe is likely to occur soon.
$HBAR l @hedera
I believe the price is forming a bull flag pattern (It could be falling wedge as well) on the weekly timeframe and is currently consolidating near the bottom of the range, setting up for a potential trend reversal.
If the pattern confirms with a breakout above this channel in the coming week, the immediate target would be $1.50–$1.70
Longer-term targets: $2–$3 and $6–$7 (Assuming circulating supply stays at ~43.47B $HBAR)
$2.00 → ~$86.7B market cap
$3.00 → ~$130B market cap
$6.00 → ~$260B market cap
$7.00 → ~$303B market cap
This is my own analysis and opinion only, nothing is guaranteed. Always do your own research and manage your risk accordingly.
[ $VELO ]
Weeks ago, weekly candle turned out to be a rejection from this macro RSI diagonal and we made a slightly lower low. With great reactions after we've now confirmed:
- a double bullish divergence,
- RSI breakout after 1y of misery.
Welcome to a HTF reversal and a new macro wave in front that should well exceed current local top at $0,039
$Altcoins are at a point of a HTF reversal
If in the next 6 days nothing major occurs, we cofirm a MACD bullish cross on 12D TF which is the lowest TF that did not produce any fake crosses in previous two cycles.
RSI to follow after


![Osemka8's tweet photo. [ $VELO ]
Weeks ago, weekly candle turned out to be a rejection from this macro RSI diagonal and we made a slightly lower low. With great reactions after we've now confirmed:
- a double bullish divergence,
- RSI breakout after 1y of misery.
Welcome to a HTF reversal and a new macro wave in front that should well exceed current local top at $0,039](https://pbs.twimg.com/media/HHoAR-DWkAUPrcU.jpg)