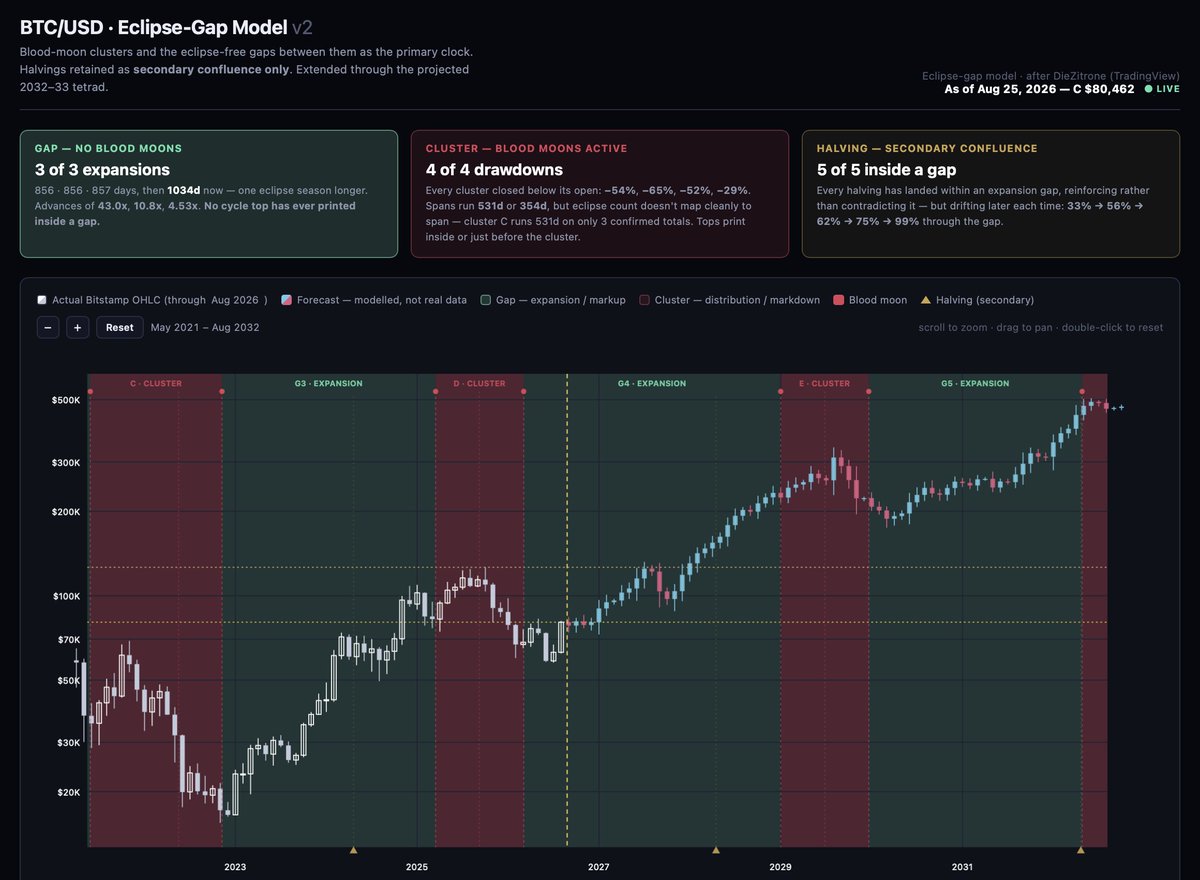
$BTC
I don’t rely on other people’s analysis. In July I ran my own Blood 🌖 Moon Cycle analysis, and based on that the bottom for this cycle appears to be in.
We’re already entering the bull market, even if it doesn’t feel that way yet since most altcoins aren’t pumping hard and $ETH still hasn’t made a new ATH.
Things can shift quickly in the coming months, and 2027 is likely to bring much higher prices across the board.
As I’ve said before, we have until mid/late 2028 before conditions start to deteriorate again.
$BTC
Just updated my Blood Moon 🌘 Cycle Weekly Chart after BTC’s wild run from $62,690 on Aug 17 to $80,500 today, +29% in 8 days.
What My Blood Moon Cycle Model is showing now
-----------------------------------------------------
BTC topped near $126K in Oct 2025, then dropped 54% to $57,735 on July 1, 2026. It’s since climbed back to ~$80K (+40%)
Looking at the last 3 Bitcoin cycles, once price hit the low it never broke below it again for 2+ years. Got close (within ~1%) but held. Only exception was 2020 (COVID)
We’re now 55 days past the $57,735 low, about the same window past cycles needed to leave the bottom behind for good. If this one follows the pattern, a drop back into the $50–57K zone keeps getting less likely every week.
However, it’s only 3 past examples. Pattern, not a proven rule. Nothing is 100%
For my first post, I’m sharing a letter @NVIDIA signed on why open models matter.
AI will transform every industry, power every company, and be built by every country.
Open models strengthen safety and cybersecurity, accelerate innovation and diffusion, and enable sovereignty.
The world needs both frontier closed models and frontier open models.
https://t.co/AUKzoQ5Ikb
@grigorypl I felt a bit tired or weak right after, but within a few days I was back to normal.
Just make sure to take iron daily and stay well hydrated.
The right shoulder low on the weekly timeframe has not yet been completed on most charts, so more patience is needed. Some charts could be forming a double bottom, meaning another low may still be needed.
I noticed that the daily RSI has not reached oversold levels across all charts. A further drop is expected before consolidation and a possible trend reversal on the higher timeframes.
I don’t know about that effect, but I just feel like it’s the least I can do for anyone who might need that blood.
For me, it’s like offering something to the temple, to the monks, or to people who are struggling, a small act that asks for nothing in return, yet somehow leaves me feeling fuller afterward. :)
I always looked away when the nurse stuck the needles into my blood vein.
The right shoulder low on the weekly timeframe has not yet been completed on most charts, so more patience is needed. Some charts could be forming a double bottom, meaning another low may still be needed.
I noticed that the daily RSI has not reached oversold levels across all charts. A further drop is expected before consolidation and a possible trend reversal on the higher timeframes.
Many charts are showing a potential inverse Head & Shoulders on the weekly timeframe, which could act as a macro reversal pattern.
For that pattern to complete and reverse higher, price will likely need to drop further on the lower timeframes to form the right shoulder.
We may need to wait a bit longer before seeing any meaningful upside.
For example: check the weekly chart of $BTC $ETH $SOL $DMTR $FET $ZRO etc.
Unfair that CEOs who aren’t into Asian girls get fewer dating options from spy agencies.
Where are the French/Russian/Iranian honeypots? Not one spy girl sent my way. Are they even trying?
France is excused — their decision-makers aren’t into girls. Everyone else: try harder!
the-open-network:native l @ton_blockchain
Daily chart under Wyckoff structure, price may be in a redistribution phase. If it fails to reverse from this zone in the coming weeks, a markdown phase could follow.