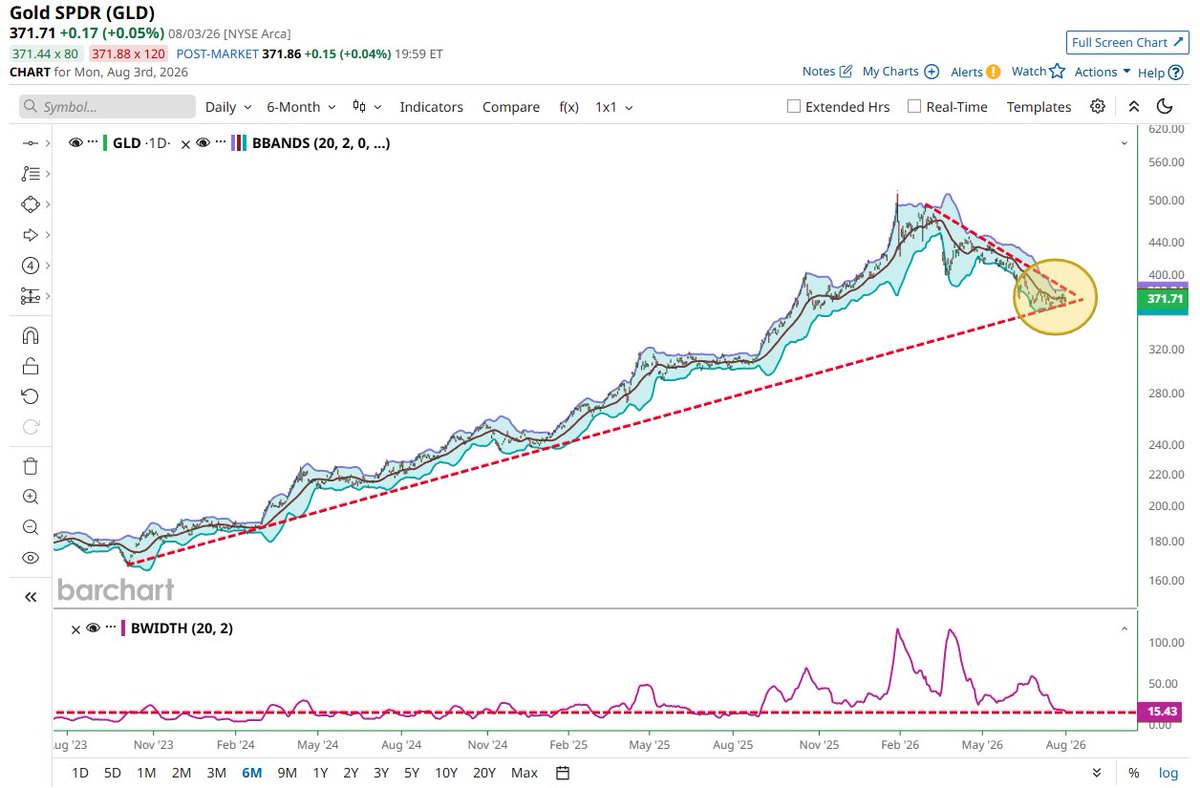
Gold is coiling and getting ready for a big move 🚨 🚨 Bollinger Bands are now the tightest since August 2025, right before Gold soared 60% over the next 5 months 🚀 🥳
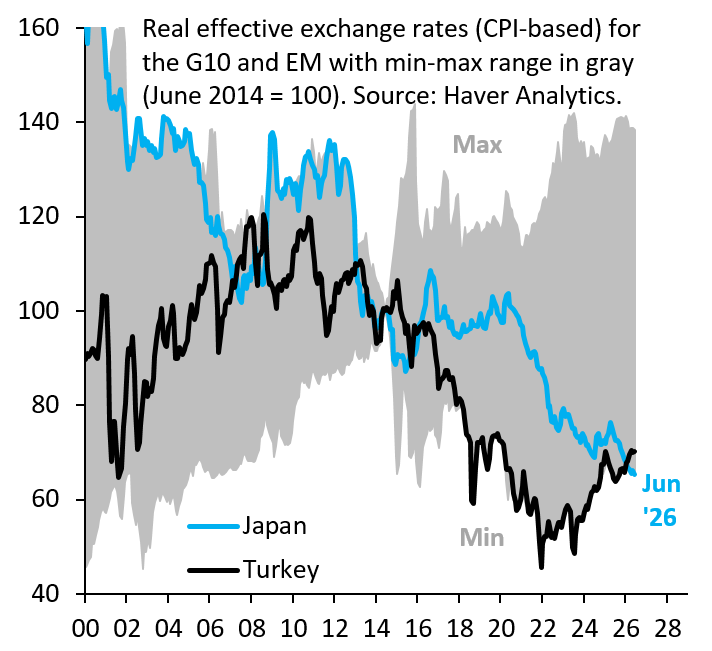
The US helped Japan intervene on the grounds that the Yen is undervalued. But currencies are non-stationary. The concept of valuation is based on mean reversion, which doesn't hold. You just have to look at Turkish Lira to see that. Yen isn't undervalued.
https://t.co/VzIBG5tGGu
🚨 BREAKING
🇨🇳🇺🇸 CHINA WILL DUMP $147,000,000,000.00 IN U.S. TREASURIES TOMORROW AT 11:30 AM ET.
THIS WILL BE THE BIGGEST SELL-OFF IN THE LAST 20 YEARS, AND IT'S THEIR LAST ATTEMPT TO STOP THEIR LOCAL MARKET FROM COLLAPSING.
LOOKS LIKE ANOTHER MARKET CRASH IS COMING...
China is trying to pop the US AI bubble.
Xi just announced China will provide 30 countries with 5,000 AI training and seminar opportunities while building international AI application cooperation centers.
China and the US have a different definition of "winning" the AI race.
The US strategy:
Spend trillions building and controlling the AI infrastructure the world will depend on through a proprietary ecosystem.
China is taking the opposite approach:
Build cheaper open-source models with similar performance and encourage the world to build on top of them.
The bet is simple:
The winner of AI will not necessarily be whoever owns the infrastructure.
.... It will be whoever builds the best companies on top of it.
Just like in the post-dot-com era...
The biggest winners were companies like Amazon, Google, and Microsoft that built businesses on top of open infrastructure.
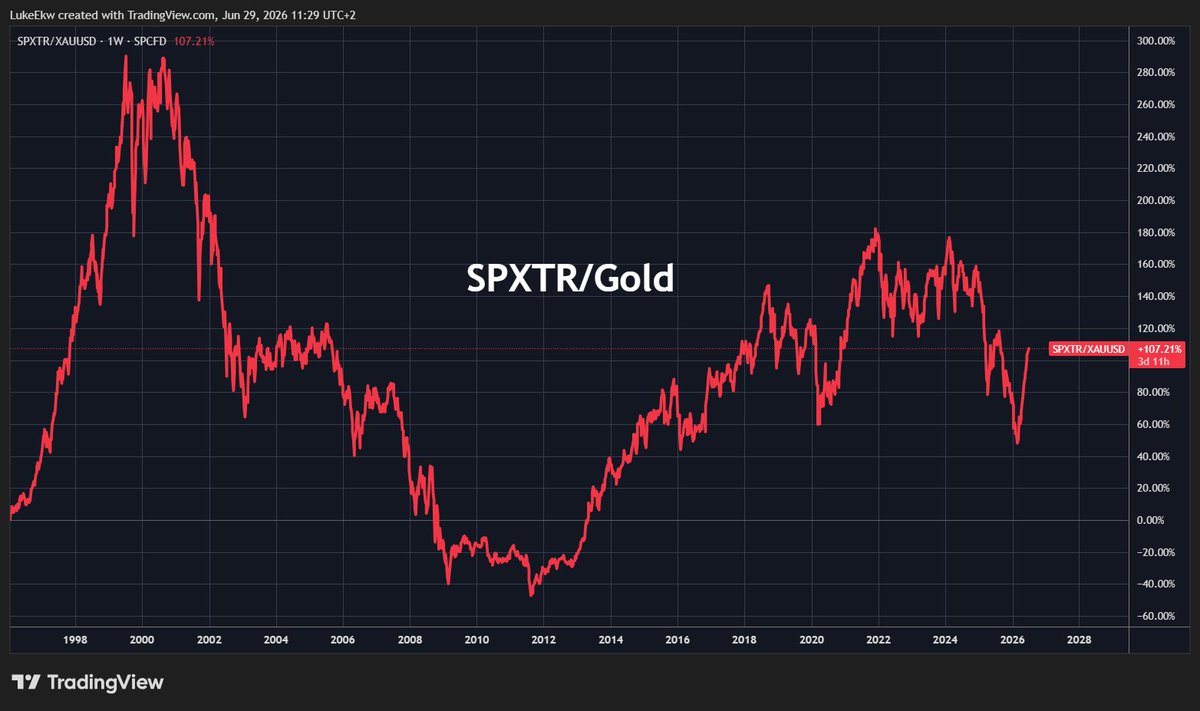
People selling gold now is the equivalent of selling gold right before the dot‑com crash.
1,000 USD invested at the peak of the dot‑com bubble:
1) In gold: $14,550
2) In the S&P: $8,000
Despite the recent pullback, gold has still massively outperformed the S&P since 2000.
In other words, the S&P’s brightest CEOs, quants and MBAs – backed by millions of workers – still got outperformed by gold just sitting in a vault.
I expect history to keep rhyming.
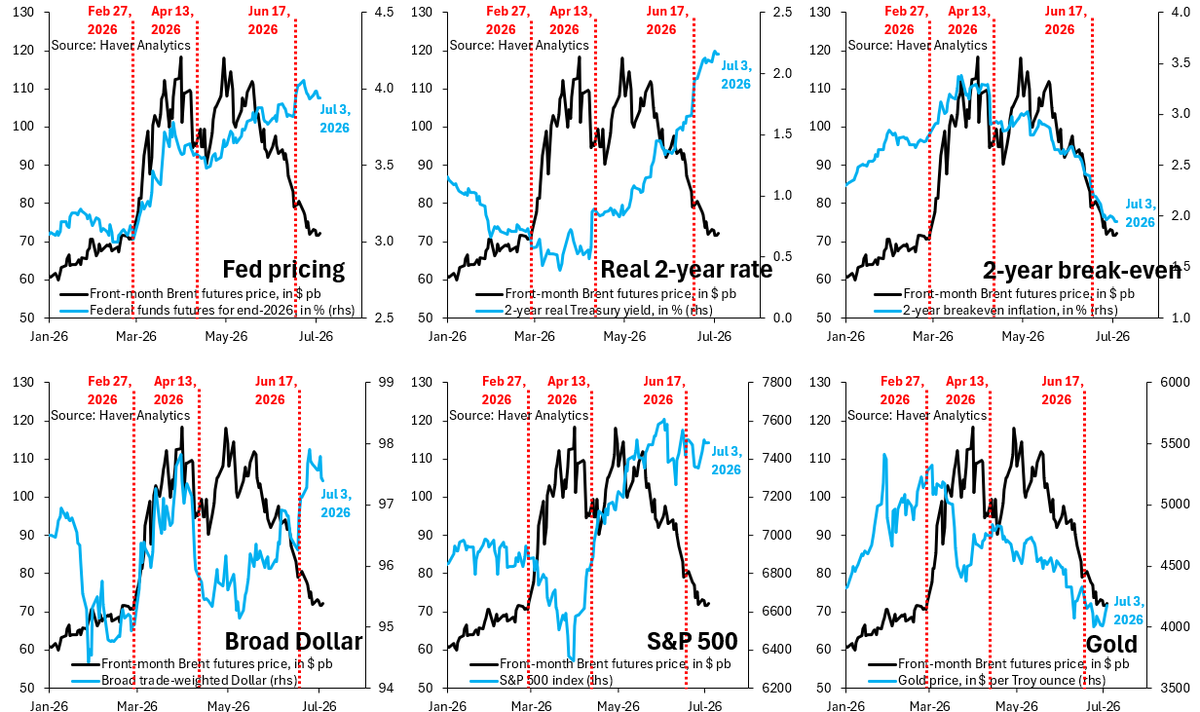
Oil prices are back to pre-war levels. You'd think that means other markets would also go back to the status quo ex ante, but that hasn't happened. That's a mis-pricing in my opinion. Most vulnerable for a correction are the Dollar and front-end US rates.
https://t.co/7UrzrNNYsi
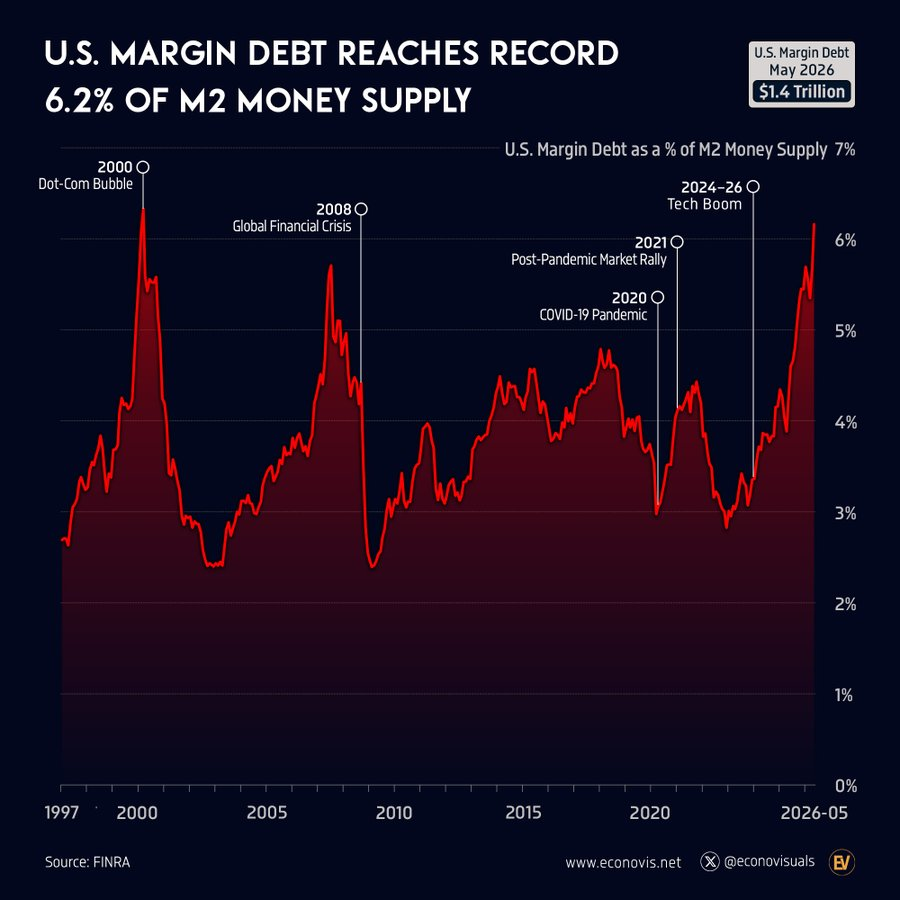
🚨US MARGIN DEBT IS FLASHING A WARNING:
US margin debt as a share of M2 money supply spiked to 6.2% in May.
This is just shy of the all-time record of 6.3%, set at the height of the 2000 Dot-Com bubble peak.
Total margin debt now stands at $1.4 trillion, an all-time high in dollar terms.
Historically, spikes in margin debt relative to money supply have preceded major market tops.
Margin debt peaked in March 2000, just months before the Dot-Com collapse, and again in July 2007, 3 months before the S&P 500 topped out ahead of the Financial Crisis.
Most recently, it peaked in October 2021, 2 months before the S&P 500's December 2021 high, preceding a -25% drawdown through September 2022.
Will history repeat itself?
BREAKING: Since the start of 2025, US jobs numbers have now been revised down in 14 out of 17 months by a total of -710,000 jobs.
May and April jobs numbers were revised down by a total of -74,000, the largest 2-month downward revision since December.
April jobs were revised down by -31,000, to +148,000, while May jobs were revised down by -43,000, to +129,000.
This means -41,765 jobs have been revised out of previously reported data, on average, in each month of this period.
If we apply this average to the +57,000 June nonfarm payrolls, it would imply just ~15,000 jobs were added last month.
Job market revisions are concerning.
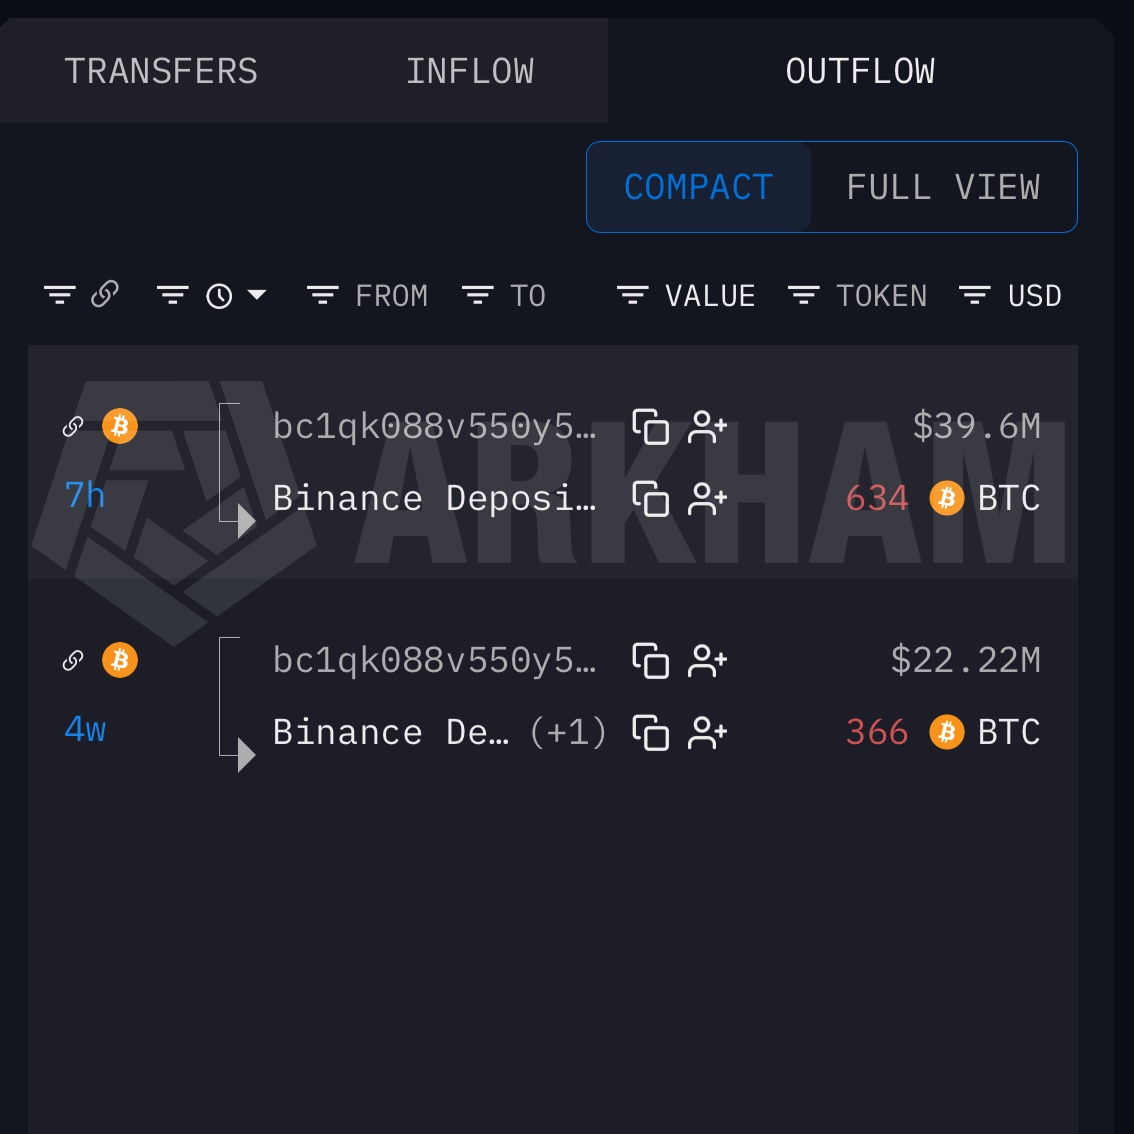
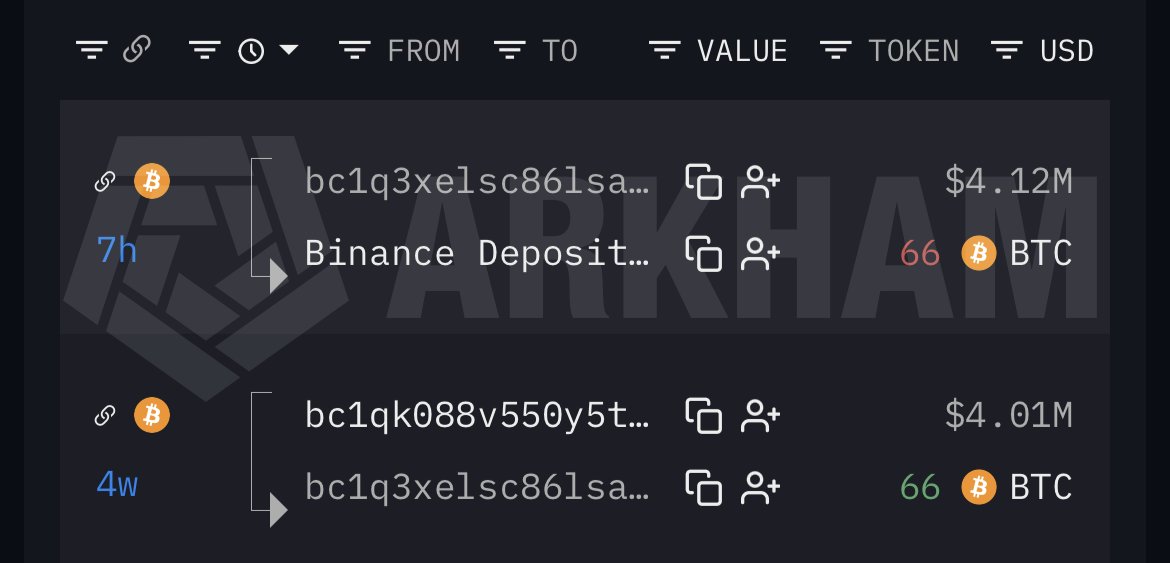
🚨ROYAL GOVERNMENT OF BHUTAN MOVES ANOTHER 700 BITCOIN
Onchain Lens flagged another 700 BTC transfer from the Government of Bhutan to Binance today.
Bhutan's Bitcoin holdings have now fallen from 13,390 BTC in October 2024 to roughly 2,000 BTC.
China’s is seeing unprecedented money supply growth:
China's M2 money supply is up to a record ~240% of GDP, the highest among any major economy in the world.
This metric has surged +100 percentage points since the 2008 Financial Crisis.
Over this period, China’s M2 money supply has surged +500% in Dollar terms.
By comparison, the country's gold reserves and total FX reserves have risen +100% and +60%, respectively.
To put this into perspective, Japan's M2-to-GDP ratio, the next highest, stands at ~185%, while the US sits at ~70%.
China's monetary expansion is unlike anything seen among major economies.
Positively, today's European industry numbers to April show no sign of higher energy prices crimping output.
Less positively, European industry has not recovered from the (much bigger) energy shock of late 2021-22.
🚨 BREAKING
🇯🇵 JAPAN WILL HIKE RATES TO 1.00% TOMORROW AT 11 PM ET, FOR THE FIRST TIME IN 31 YEARS!
ODDS ON PREDICTION MARKETS ARE NOW AT 99%.
HISTORICALLY, EVERY RATE HIKE IN JAPAN HAS BEEN FOLLOWED BY A 20%+ DUMP IN $BTC.
THIS WOULD BE REALLY BAD FOR MARKETS...
INSIGHTS:
The relationship between bonds and stocks just hit its most extreme level in 15 years.
The correlation between the 10-year Treasury yield and the S&P 500 dropped to -0.62.
The lowest in at least 15 years.
More extreme than the entire 2022 bear market.
Here's why this matters:
After 2008, rising yields meant rising stocks.
Growth was driving both.
Now rising yields mean falling stocks.
Because rising yields reflect inflation fear.
Not growth optimism.
Japan dumping bonds at a 30 year record.
China at an 18 year low.
Turkey sold 89% of holdings in a month.
G7 yields at the highest since 2004.
Every time yields spike from here.
Stocks could fall in response.
Keep watching the bond market.
It's telling you more than the stock market is.