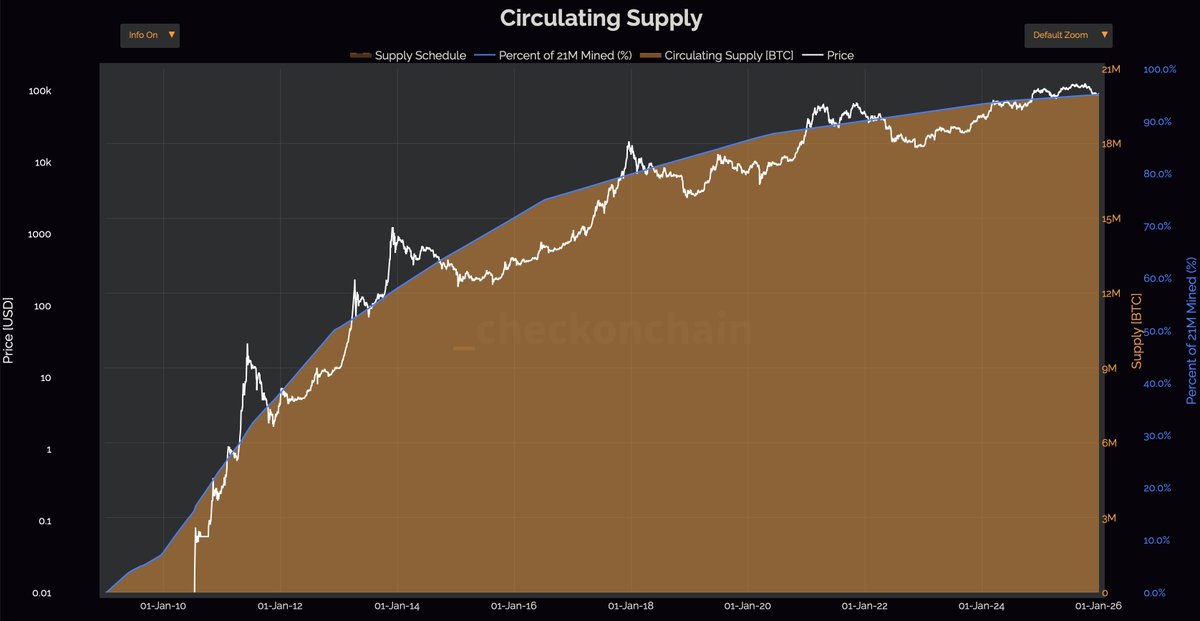
There are now 20 MILLION BTC in circulation, with the remaining 1 million BTC to be mined over the next 114 years.
The vast majority of the world doesn't understand how wild that statement is.
Bloomberg gets a comment today from Abu Dhabi Investment Council:
A spokesperson...said it’s building an allocation to Bitcoin as part of a long-term diversification strategy, and described the token “as a store of value similar to gold."
https://t.co/ZBAjx9Mwym
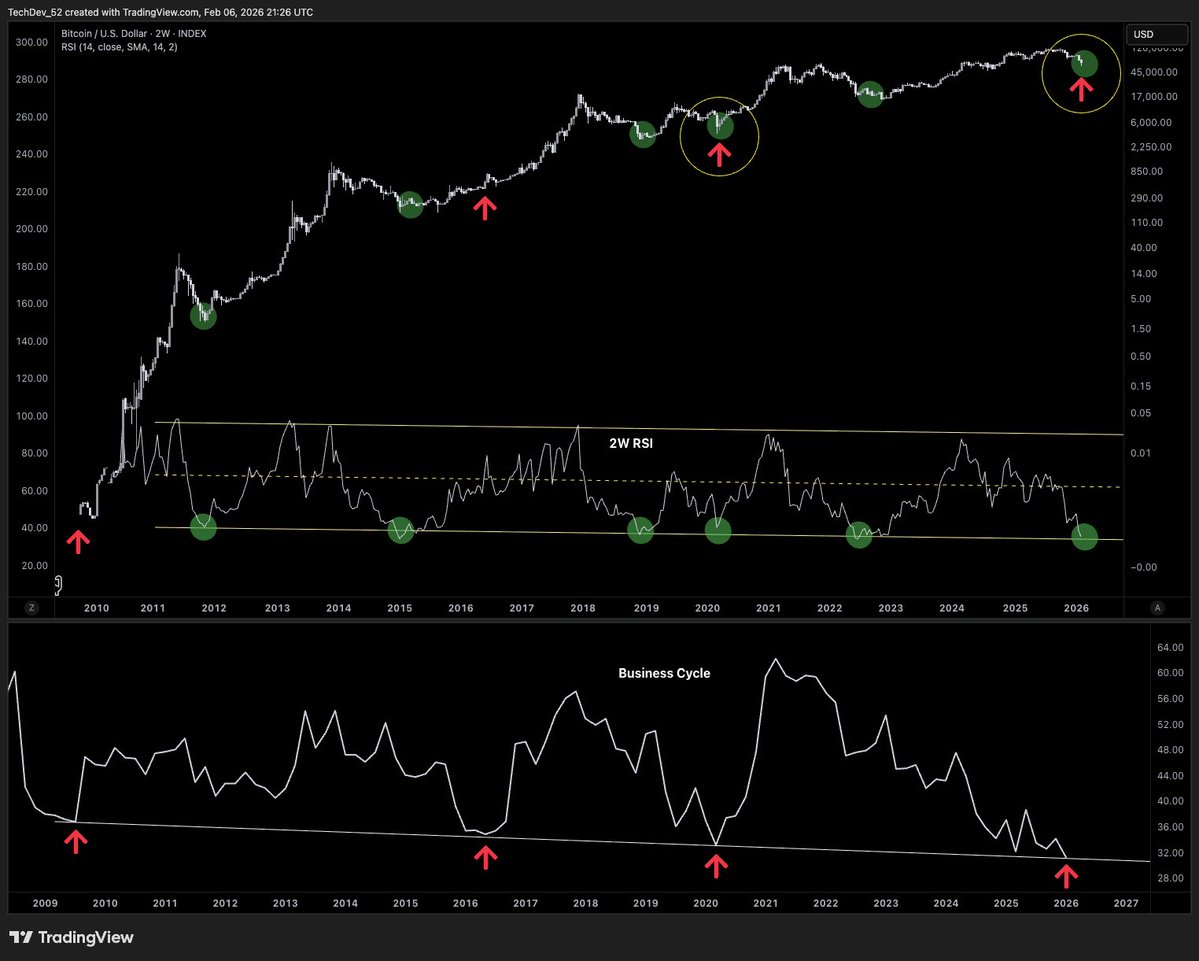
It's time once again for Bitcoin's 2W RSI channel.
Green circles = Peak oversold bottoms
Red arrows = Max potential energy at business cycle lows
Interesting pairing we have here.
Only seen once before...
BTC holders have long viewed it as a hedge against currency decline. But this is not a widespread perception among the general investing public, where gold has always been seen as the asset for that (and where BTC has been viewed from more of an emerging technology angle). Watch this closely. If BTC starts to react to specific dollar moves, and the media and public perception of it as “protection” starts to spread, it would be very important.
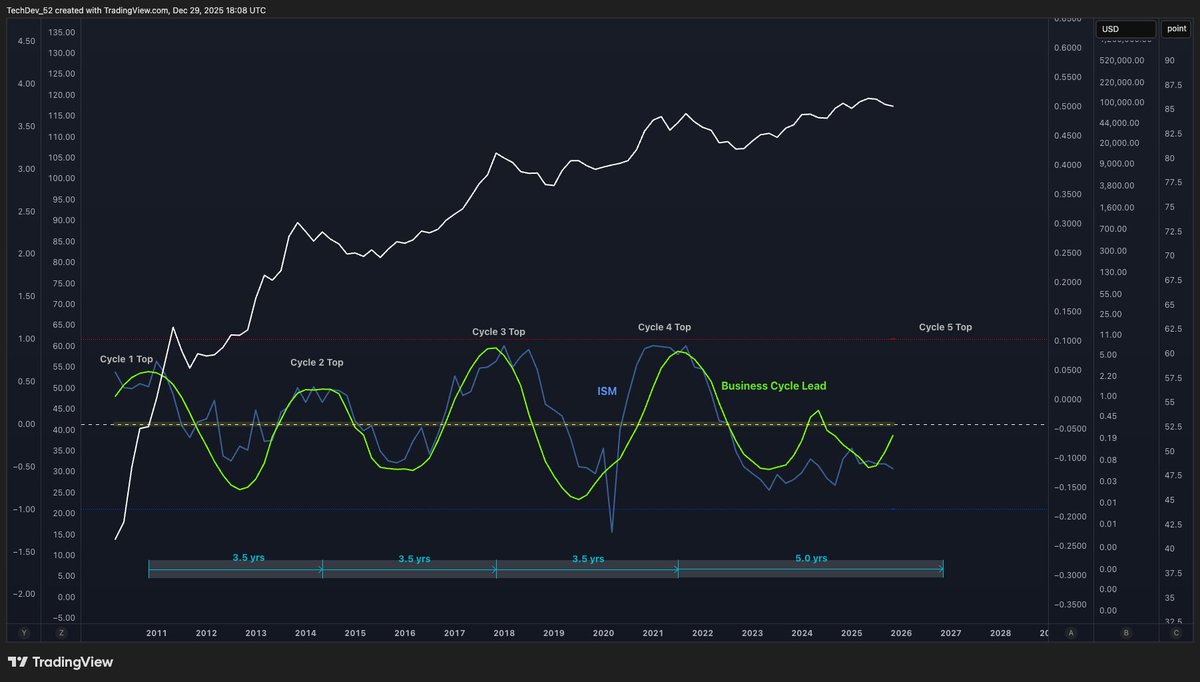
Let's simplify things.
The 4 yr cycle was only the 4 yr cycle because the last three business cycles were ~4 yrs.
The global business cycle has always driven Bitcoin's. When it topped, Bitcoin topped. When it reversed off the bottom, Bitcoin went parabolic. Even the shapes of charted business cycle metrics have dictated the shapes of Bitcoin cycles.
ISM is a well-accepted measure of this business cycle. Look at the last 3 yrs. A mini-cycle at best, flat at worst. ISM never pushed above 50, and thus crypto never went parabolic. Halving or not.
Why? A strong argument for the ~4 yr business cycle cadence has been the ~4 yr refinancing cycle of US debt. This time, the US holds an additional ~1.5 yrs of average debt maturity due to the COVID-induced rate crash. Likely extending the business cycle by ~1.5 yrs. @RaoulGMI and @BittelJulien have spoken about this at length.
Now to look ahead.
The green signal has always mirrored ISM. More recently, it has led.
What do we see? A major uptick off the bottom. The stuff that starts Bitcoin runs, not ends them. Not on the hourly chart. On the monthly and quarterly.
ISM is expected to follow, and finally lift off its 3 yr floor.
Fifteen years of history tells us what crypto likely does next.
Bitcoin's 128 day moving average 🔵has dipped below the 200 day moving average 🔴
The last 3 times this happened (🟡circles), Bitcoin's price increased soon after.
This chart puts weight in the argument that Bitcoin is ironing out a bottom before pushing higher.
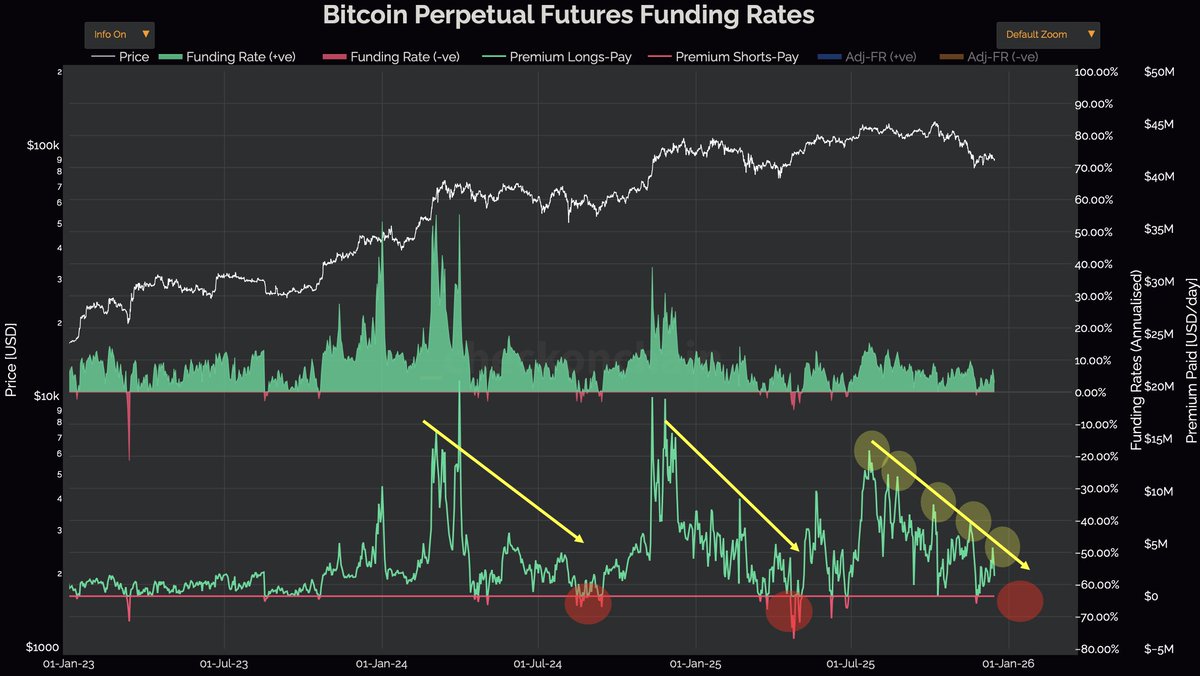
As expected, the premium that Bitcoin longs are paying shorts on leveraged trades reversed at the top of the descending pattern that we've seen since July.
This chart suggests a bottom is being ironed out but a further drop in both price and funding rates is expected first.
Bitcoin Monday Thoughts:
Ranging between key levels. 200DMA ($110K) and 365DMA ($102K) have acted as cycle supports.
Funding remains muted, with resets suggesting that a proper flush may have occurred in October.
Leverage reset visible, which has historically coincided with local bottom forming. Keeping an eye on @binance funding and open interest due to the high % of OI on Binance to total OI in the market.
STH SOPR compression suggests volatility is coiling before the next major move.
Sentiment down bad amongst retail investors while being better than ever with institutions and governments.
Sitting comfy in spot. BTC over $100K going into November of a bull market with sentiment and leverage reset and macro tailwinds (QT/QE situation).
Short term, letting the rubber band snap and seeing which way it flies.
Medium to long-term, nothing has changed yet for Bitcoin and the bull market.
A clear rejection at the STH Cost Basis reflects fear around break-even levels. This temporary loss of confidence has historically aligned with short-term bearish phases.
$113.2K remains the level that bulls must flip to support to keep the Bitcoin party going.
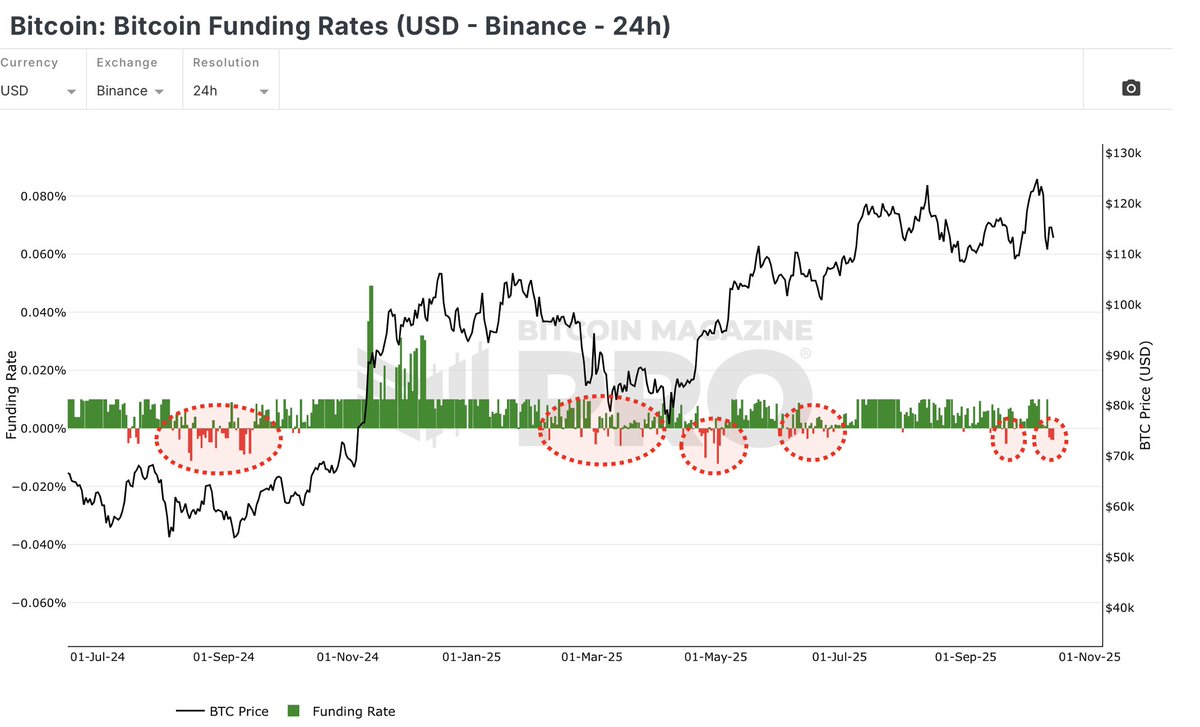
Funding on Binance turned negative for the 3rd day in a row.
For markets to bottom, a bunch of variables need to align.
Negative funding rates on the exchange with the lion's share of open interest is certainly constructive to a bottom forming.
The MVRV Z-Score right now: 2.12
In 2021, during the true cycle top: 7.13
At the peak in 2017: Over 10
Prior cycle peaks were between 7-10
This suggests that a big move is yet to come 🚀