❗Check out our newest blog about #Algotrading❗
#algo#Algorithmictrading#blog
Algorithmic trading uses a defined set of rules to place trading orders on exchanges.
Read more in our newest blog:
https://t.co/bSsAAC4V9L
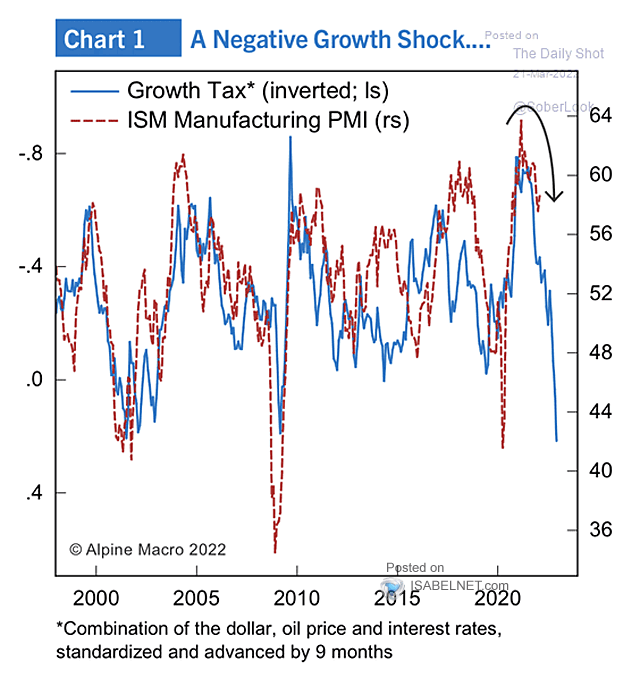
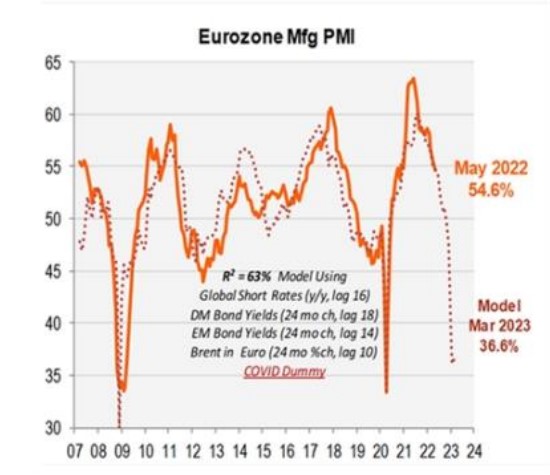
Another interesting PMI leading indicator that suggests plausible severity of anticipated PMI drop, currently indicating PMIs at 45 by 2023 i.e. global recession territory. Roughly what is already priced in SP500. Markets seem to be efficient at least on this front.
Morgan Stanley Research suggests equities have further downside ahead to fully price in recession. This outlook is shared with Piper Sandler, whose EU PMI model predicts 2008-like PMI recession.
Interesting take on how 2008-like selloffs on SP would look like during market downturns in the past 10 or so years. Selloff of similar magnitude may be applicable now, given the elevated inflationary recession risk stemming from market perception of "Behind the curve FED".
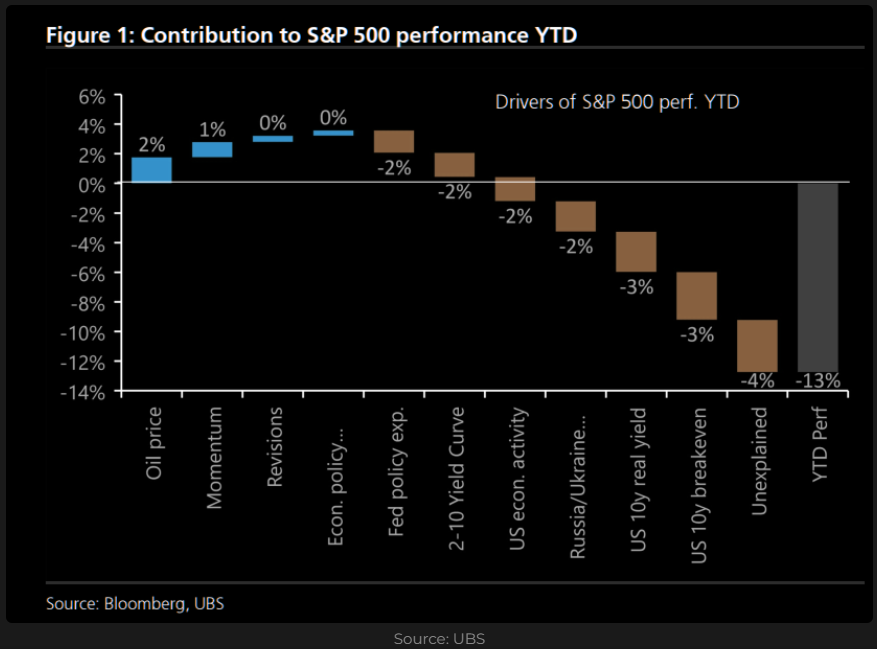
UBS machine learning model disassembles YTD S&P 500 returns into various components / factors. It seems as though Bond market pricing in stagflationary scenario, explains most of the stock market performance pain we have seen this year.
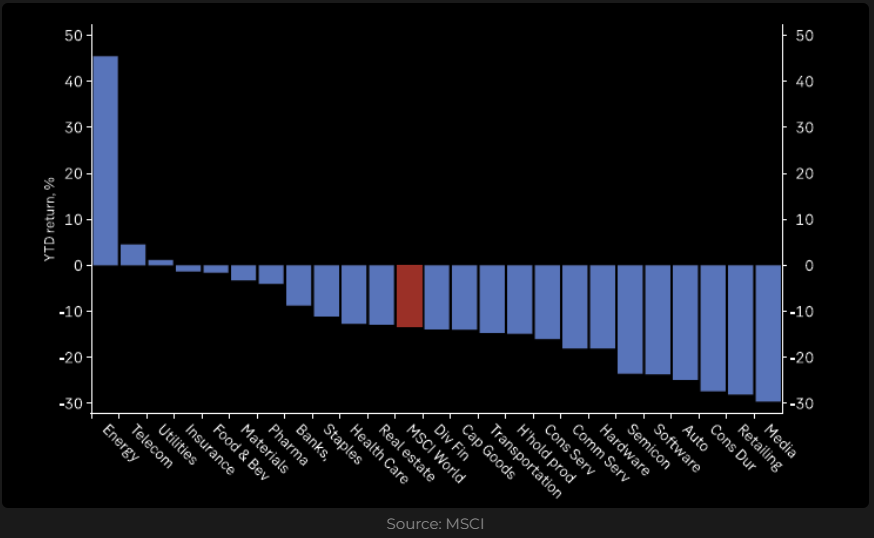
YTD returns of various MSCI sectors has sole winner this year 👉Energy 👈 that has absolutely obliterated other sectors in performance. Telecoms and Utilities are at least floating in green, which cannot be said about remaining 21 sectors.🛢️
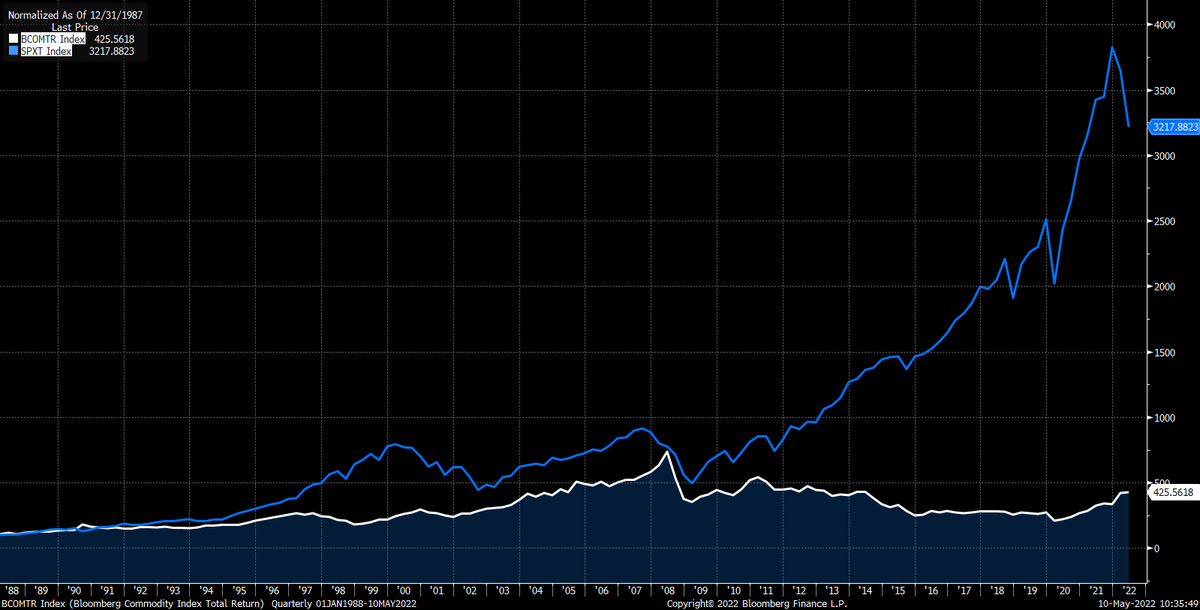
Despite recent rapid increase in prices across the commodity spectrum, commodities still remain relatively cheap relative to financial assets, as the graph depicts.
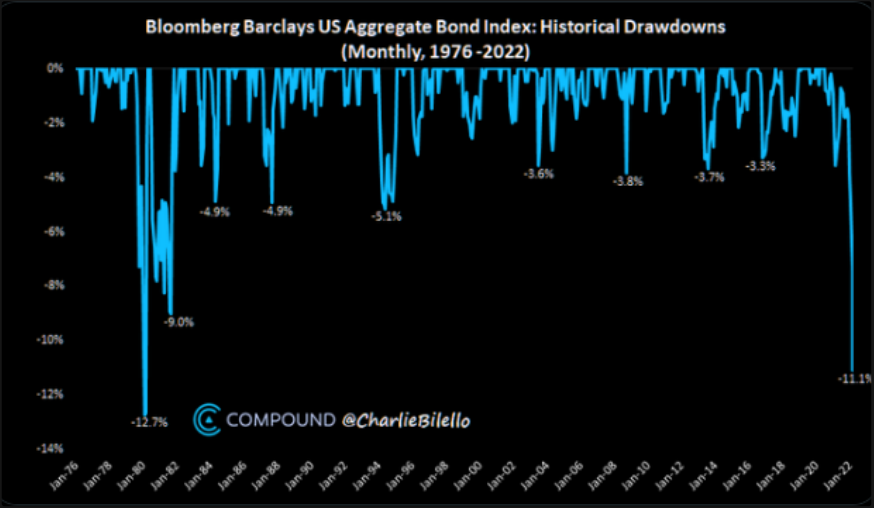
Bonds are experiencing worst times since the Great Inflation of 1980s, while similarities between the two periods are becoming ever more striking, at least on the inflation front.
Barclays US monthly aggregate Bond index drawdown is currently printing -11,1% for April 2022.
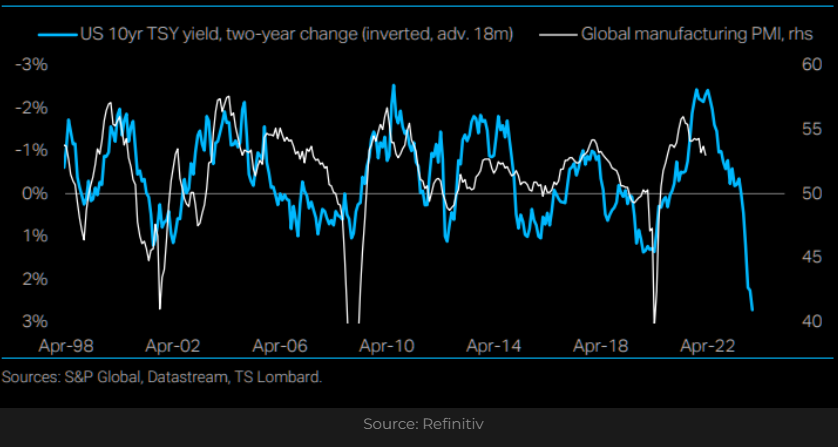
Surprisingly stable leading relationship between inverse of 2 year ROC of 10 year yield of US Treasuries and Global manufacturing PMI, implies deeper than normal recession ahead. Either that or Treasuries are very oversold today. 📉
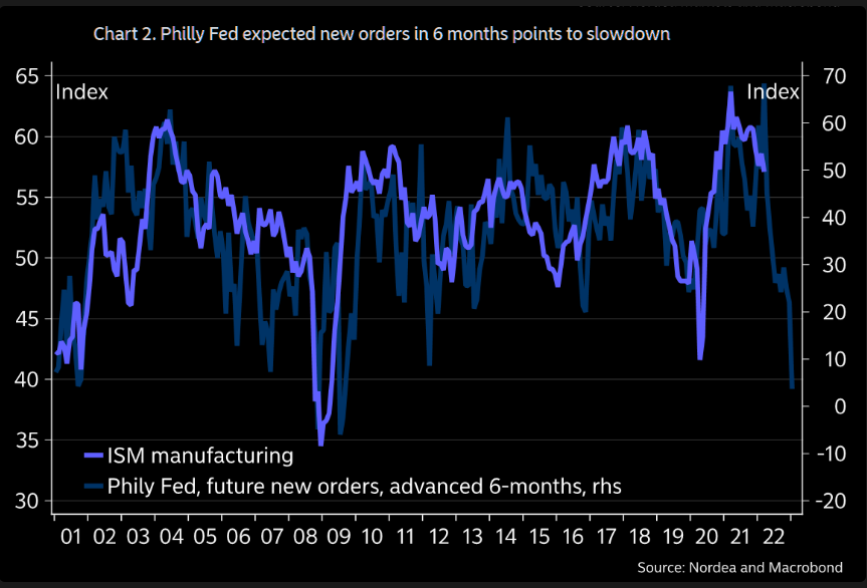
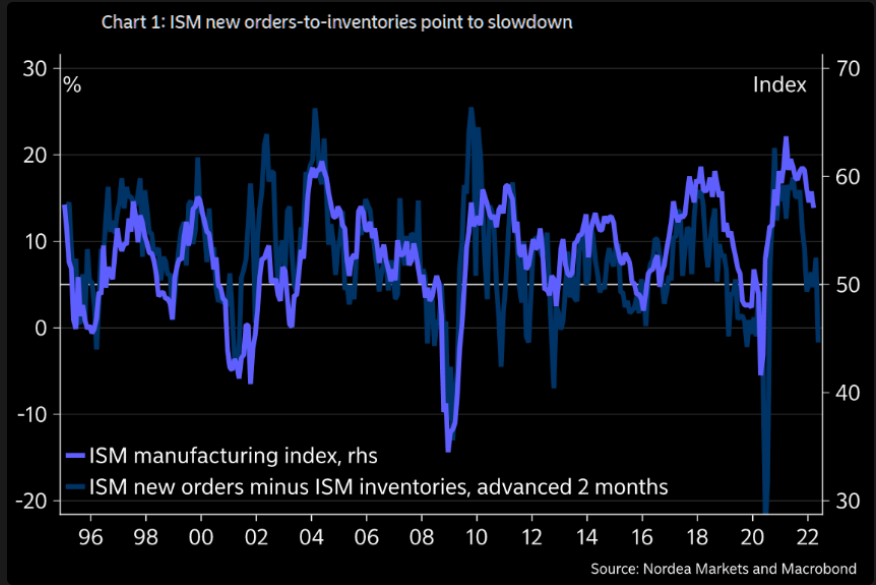
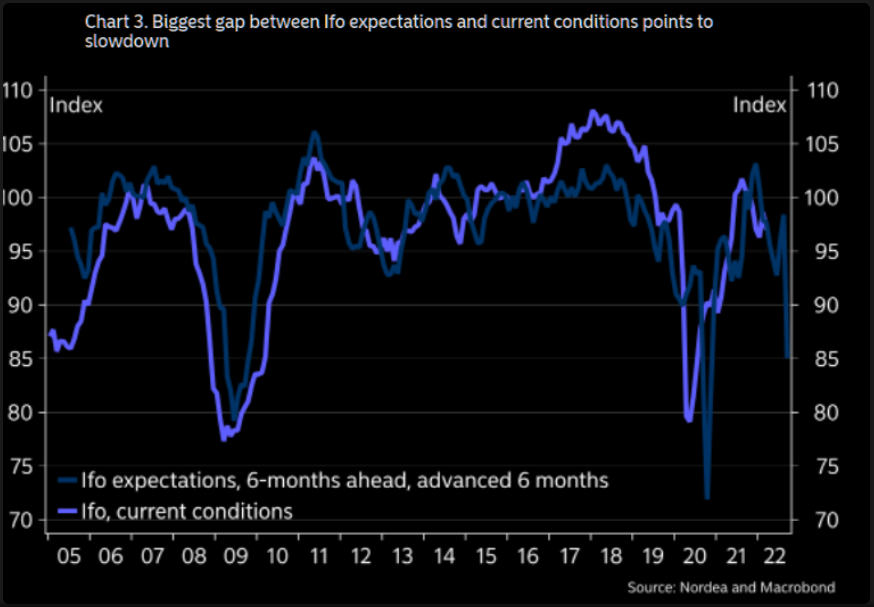
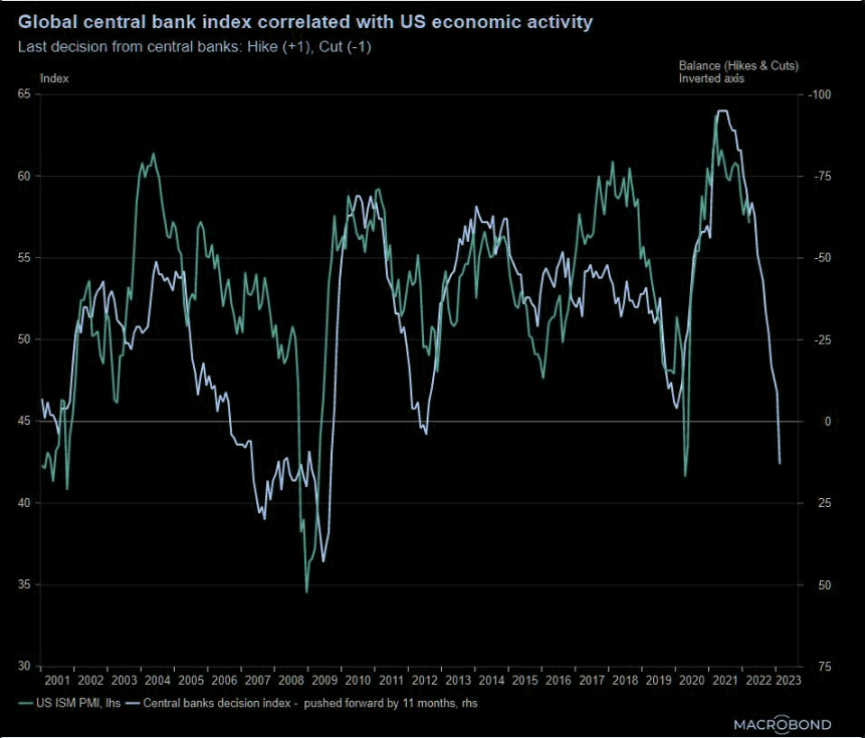
Nordea and Macrobond have released nice graphs depicting lead-lag realitionship between economic activity indices and various predictors. All are pointing to economic slowdown and recessionary enviroment in 2H 2022. That applies to both US ISM manufacturing German IFO indices
Future of US economic activity as indicated by past Central Bank rate decision behaviour points to dramatic contraction as soon as Q3 2022. Stagflationary enviroment is back 📉📈 📊
If history and mean reversion is of any relevance, we might be looking at peak 10-Year US yield for current business cycle soon, along with potentialy ever more degrading economic news feed. Inflation level is however substantialy higher than previous cycles.
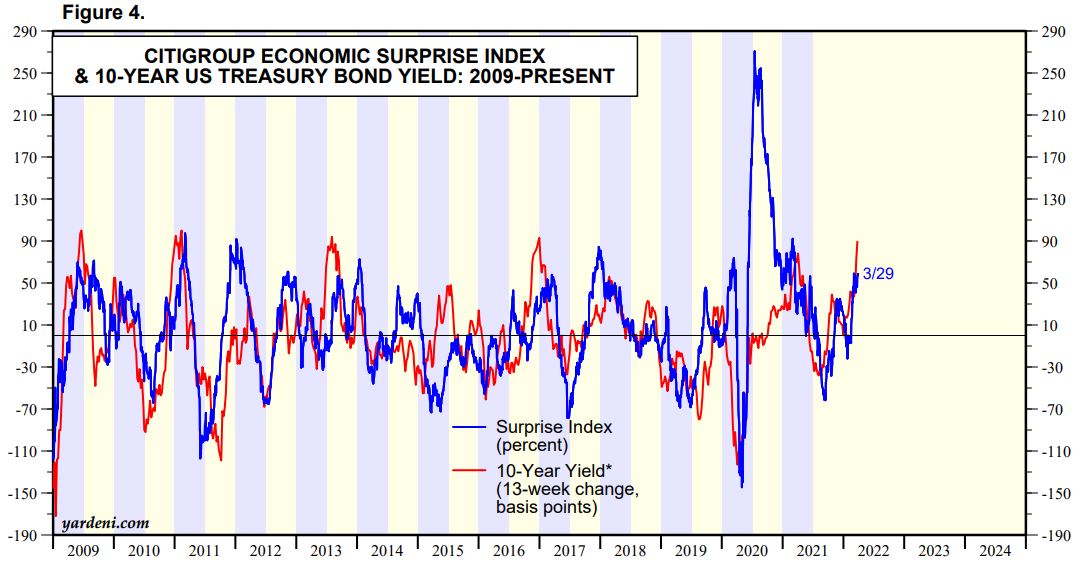
On the pic below, Goldman tries to compare current energy shock with 1990 S/L Crisis, which was also preceeded by large upside price volatility in energy markets. GS concludes that "This [Forecasted Recession] is not the case in 2022 thanks to strong payroll and wage gains."
US Financial Conditions as measured by FCI by Morgan Stanley are still relatively easy compared to previous years. If recent history is any guide, we can assume conditions have space to tighten even further in the upcoming year before imminent risk of recession ensues
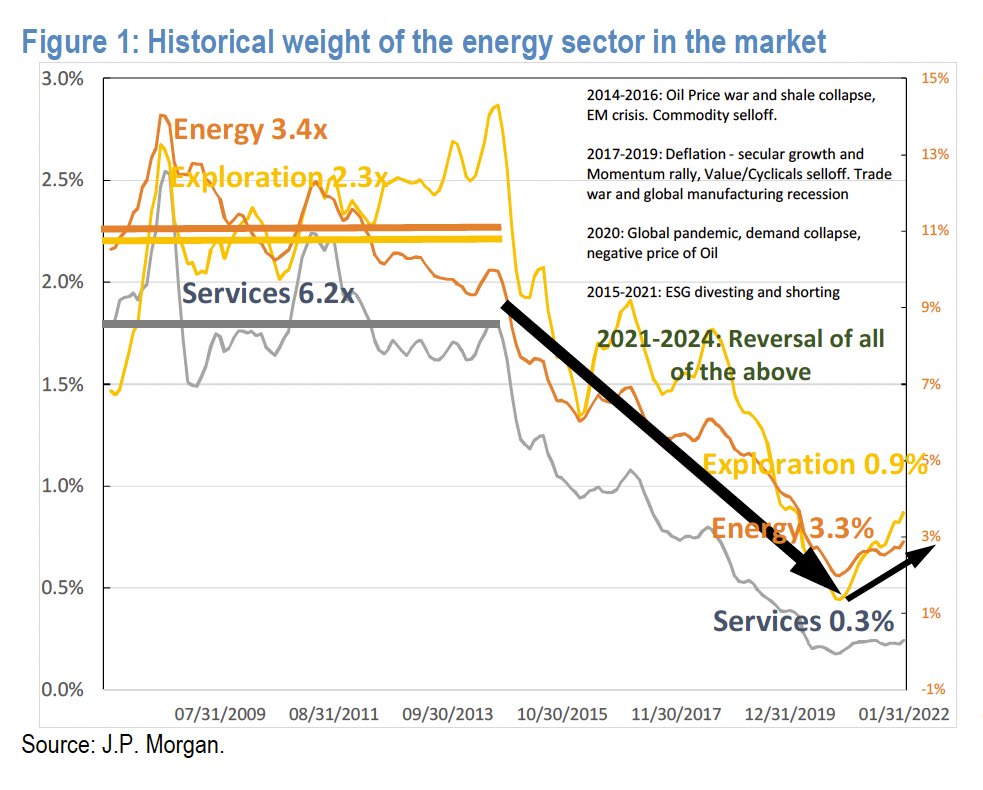
JPM believes that “the energy crisis will end when the energy sector attains the same relative weight as during the previous commodity up cycle”. That would mean that we shall expect massive energy sector appreciation or huge other sectors contraction. What would prevail?








![NutitCZ's tweet photo. On the pic below, Goldman tries to compare current energy shock with 1990 S/L Crisis, which was also preceeded by large upside price volatility in energy markets. GS concludes that "This [Forecasted Recession] is not the case in 2022 thanks to strong payroll and wage gains." https://t.co/TVfYVERsH2](https://pbs.twimg.com/media/FOssOePXEAA2y4f.jpg)