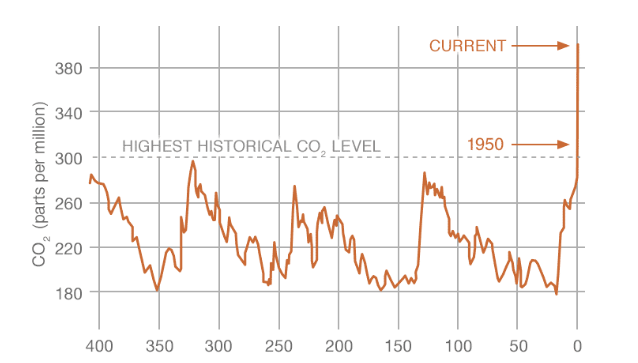
Keep up with the latest carbon dioxide concentrations for our atmosphere: https://t.co/bQwvfaYTDm Jan. 2020 reading was 413 ppm. @NASAClimate has graphs & #data to download! The #ORNLDAAC also offers a variety of carbon cycle datasets: https://t.co/ZsdEB0F1tc
#ICYMI: The Vista-CA dataset from the North American Carbon Program
@NACP_Carbon provides locations of potential #methane (CH4) emitting facilities & infrastructure across the state of California. https://t.co/KVXf0X0pvI Used to support the California Methane Survey project.
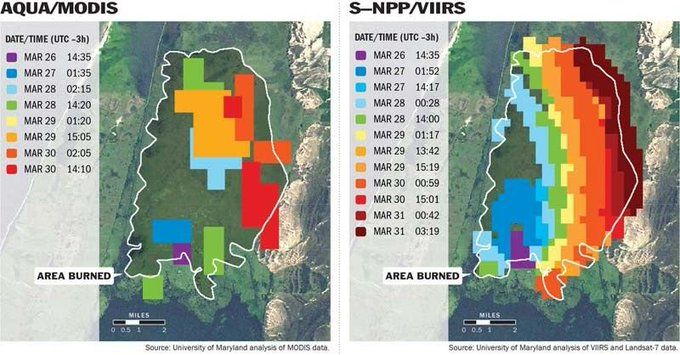
What's the difference between #MODIS & #VIIRS? VIIRS is younger, different spatial resolutions & spectral coverage, no orbital gaps, will eventually replace MODIS. Image compares #wildfire#data from the two instruments: https://t.co/kmU477zQ8K
Plants are important to the global #carbon cycle! 🌲s absorb CO2 during photosynthesis, store C above/below ground, produce O2. The #ORNLDAAC has >700 data holdings on forest structure/cover/biogeochemistry. Find one that's applicable to your research: https://t.co/HaVh1KDG8x
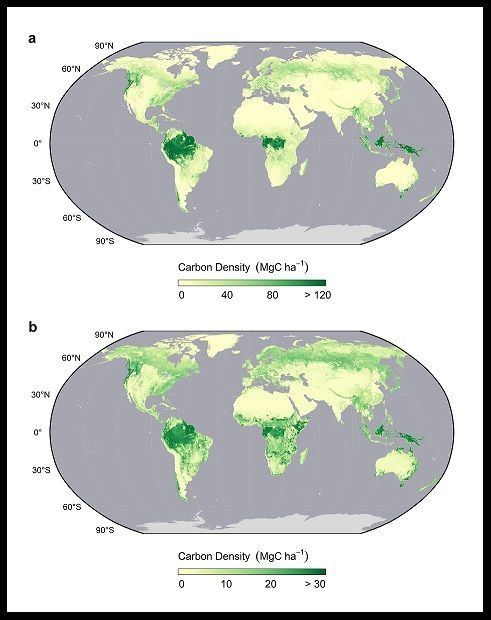
#New dataset: Temporally consistent & harmonized global maps of above- & belowground biomass carbon density are available! https://t.co/iPn0eZjo1c #Data are for the year 2010 at a 300 m spatial resolution. The accumulated uncertainty of pixel-level estimates are also provided.
Christine Laney (@cmlaney), Isaac Larsen (https://t.co/eps0g2eGB9), Alexey Shiklomanov (@ashiklom711), & Ying Sun (@gisgter2008) will join the ORNL DAAC User Working Group this year! Welcome, new members! #biogeochemistry#ecology#DataScience
🌎🗓 T-43 days until #EarthDay50
From space, @NASA can track damage to roads and homes after hurricanes, helping first responders and communities direct aid where it's needed most.
https://t.co/KABTBSK4qe
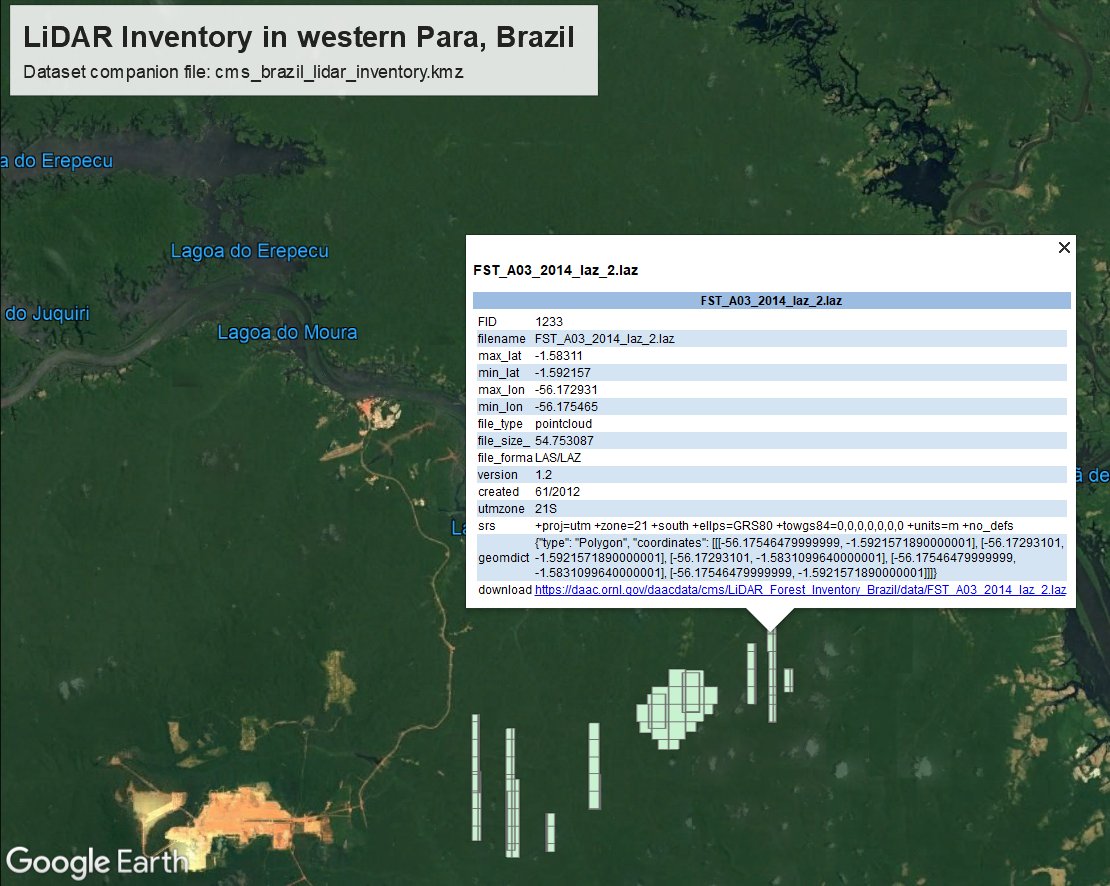
Get the catalog of point cloud #data collected during #LiDAR surveys over the #Amazon#rainforest in #Brazil from 2008-2018 for the Sustainable Landscapes Brazil Project. https://t.co/tbDClr4sd2 Data made available by the Carbon Monitoring System @NASA_Carbon!
Beautiful 🌏
On April 22, the world will celebrate the 50th anniversary of #EarthDay.
Follow @NASAEarth for its 50-day tribute, starting today, exploring how NASA’s Earth science, technology and space exploration are essential to the future of our planet.
We love #OpenData! "Open science can lead to greater collaboration, increased confidence in findings & goodwill between researchers." https://t.co/I5WU1NdtU0 We assign all data products a DOI, making them easier to cite & discoverable. DOI Search: https://t.co/9n5wXfScF5
Dr. Liz Hoy studies Earth’s Arctic ❄️ and boreal regions, looking at how fires 🔥 affect carbon storage in a warming climate. She travels to Alaska and Canada during the summer with the #NASA_ABoVE field campaign. #IWD2020
https://t.co/44uVnjSSNy
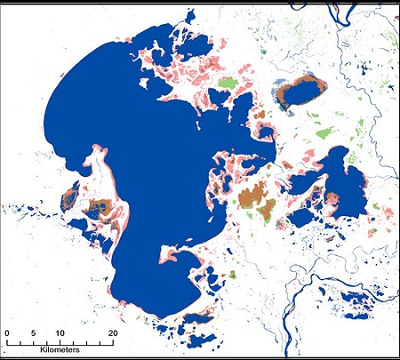
#ICYMI: @NASA_ABoVE dataset "ABoVE: Surface Water Extent, Boreal and Tundra Regions, North America, 1991-2011" https://t.co/wQGK0xfwV4 has been cited 4 times & downloaded >800 times! Data were derived from time series of #Landsat TM & ETM+
#DYK that there are other DAACs out there besides @ORNLDAAC? We all serve the @NASAEarth Observing System to ensure that #data collected during #science missions is easily accessible. Do you want to use our data? Find out more https://t.co/IDRTIhVlcg and follow @NASAEarthData
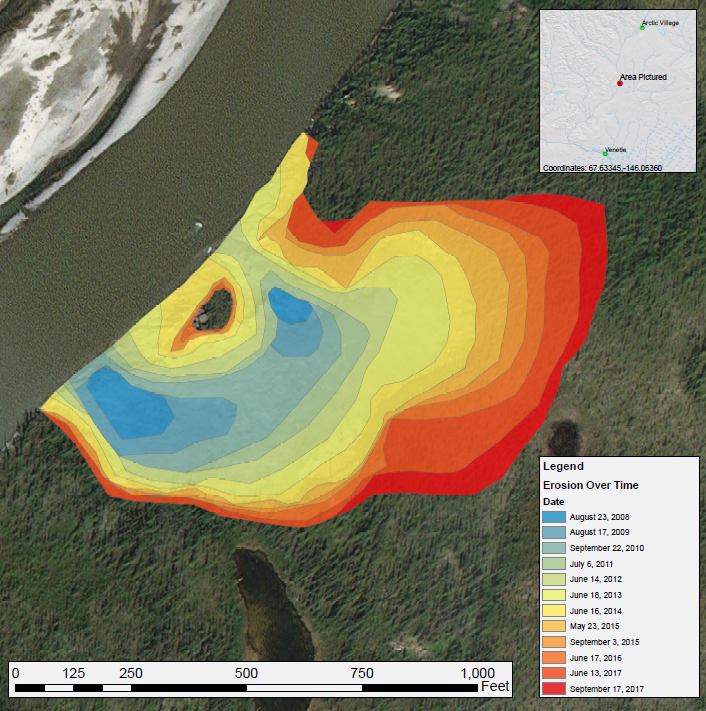
Get these #data from Arctic-Boreal Vulnerability Experiment
@NASA_ABoVE: A time series of Landsat-derived maps shows the expansion of a thaw slump on the East Fork Chandalar River in #Alaska from 2008-2017. https://t.co/GgN2B37qZ7
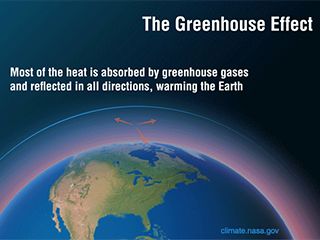
Ever wondered, "what's the greenhouse effect?" See this simplified animation from @NASAClimate: https://t.co/mosHu5eYRz Even download the animation for presentations! The #ORNLDAAC provides access to #climate https://t.co/6Y8R0vqHSd & #carbon cycle https://t.co/ZsdEB0WCkK data.