#Bitcoin
🔸Currently back below the previously broken downtrend, ideally closing the week back above
🔸Retraced to the ~0.786 the move from 60.5k to 82.7k
#Bitcoin cycles count
🔹Still assuming cycles modulated to around ~80 days and ~40 weeks cycles
🔹Next daily cycle low could be around end of April/Early may
🔹1st chart - Notice how the daily DSS Bressert is in the overbought zone and could be turning around in the coming weeks to go to the cycle low?
🔹 2nd chart - Weekly cycle should still be in the upwards phase, next weekly low should be around November. Notice how the weekly DSS Bresset recently had its bull cross, is bullish & pushing upwards and could still have some time to push to the overbought area by ~June?
#Bitcoin cycles, a very interesting post below from David, with a Video showing the modulation of the daily cycles from 80 days to 60 days to 80 days again.
Below my manual chart for the highlighted ~80 days and ~40 weeks cycles.
#Others/#BTC charts update
Been a while I did not check it, but Others is not losing ground and holding relatively well against BTC. Alts are not behaving like 2022 or 2018 bear markets.
🔸Monthly chart, still holding the yellow uptrend, monthly RSI still holding its bull cross and positive slop.
🔸Weekly chart showing something similar, RSI also grinding up making higher lows.
, yes this would make the most sense if it happens. Btw depending where we close this week, the indicator will probably flag a potential low probably weekly high if we don’t recover the damages done. Same happened in March 2023 but the potential high did not get confirmed back then if you look at the videos below
#Bitcoin weekly momentum - Where are we ?
After a confirmed weekly cycle low (blue labels), when the DSS Bressert pushed to reach 82.6 (where we are just now), before going to the next cycle low Bitcoin continued to push higher as below:
🔹34% February 2023
🔹83% November 2023
🔹35% November 2024
🔹25% June 2025
🔸May 2026 ? An example of 21% would send us to ~$93k
#Bitcoin weekly momentum - Where are we ?
After a confirmed weekly cycle low (blue labels), when the DSS Bressert pushed to reach 73 (where we are just now), before going to the next cycle low Bitcoin continued to push higher as below:
🔹45% February 2023
🔹99% November 2023
🔹60% October 2024
🔹19% May 2025
Let see this time what figure this weekly momentum will give us.
The big #crypto riddle - how is that even possible?
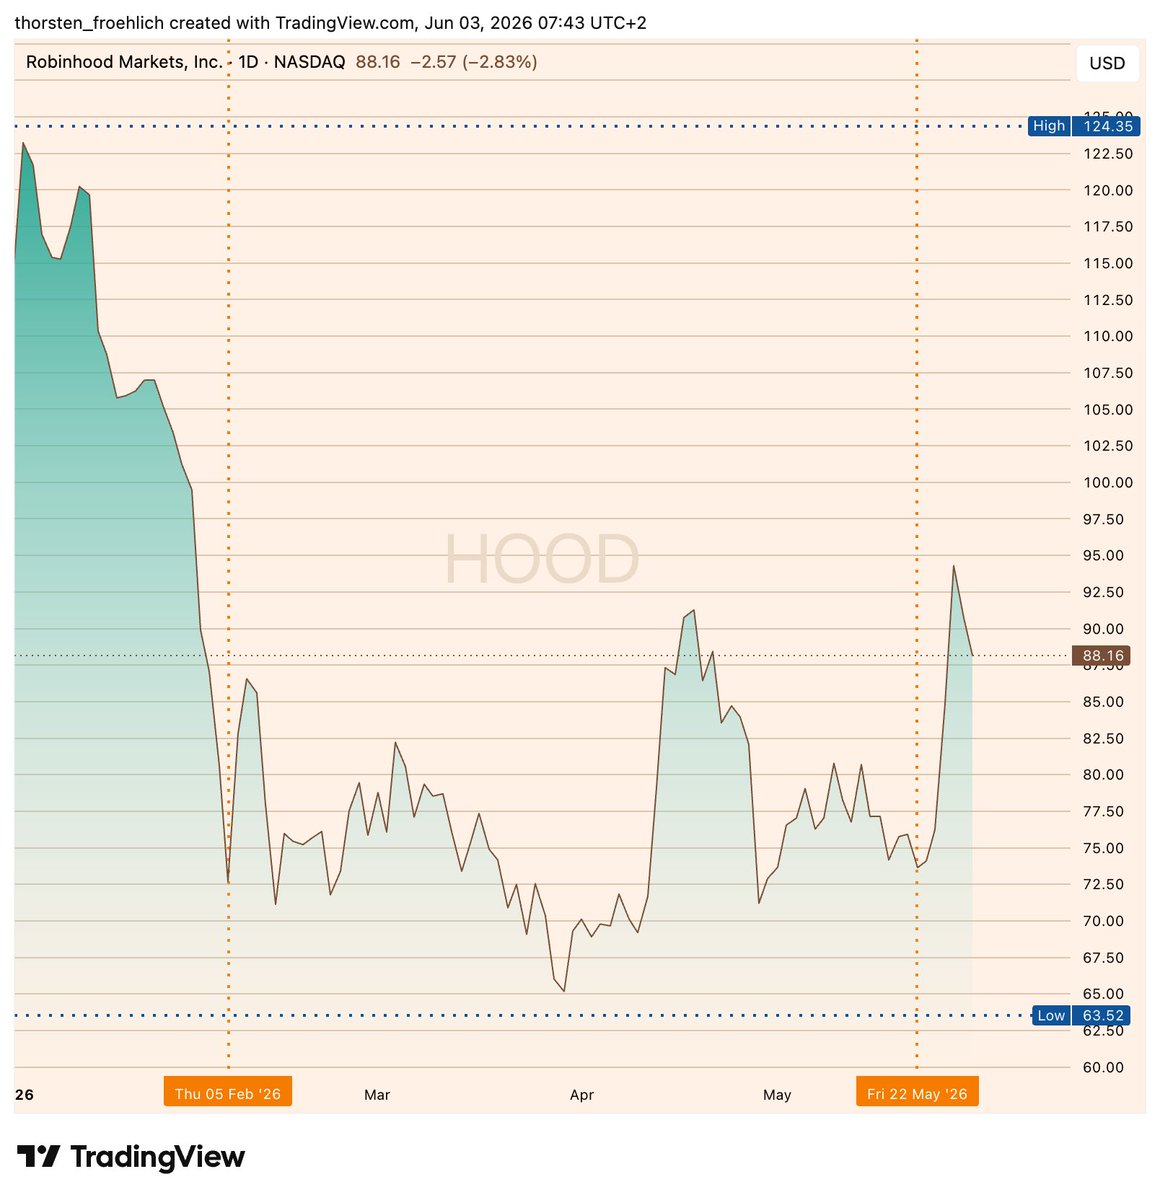
$XYZ (Blockchain payment rails) historically broke out ahead of a wider crypto rally / bounce. I wrote about this a few days ago. As long as Block does not break down, the odds of a crypo revovery are fairly solid imo and the market may (or may not) anticipate the Clarity Act. Even $HOOD has broken out again.
June 2025
November 2023
NOW
...and there are more examples in the past.
I was specifically looking at XYC up and ETH + BTC down.
#Bitcoin if one can ask, retracing this early week dump and forming a big weekly wick, like early March 2023, would be a nice outcome to conclude this week.
Fully agree with @Sykodelic_ here, this move is very off from the norm.
The setup I started tracking few weeks ago did indicate short term pain, but the downside is very exaggerated from the consensus view according to top historical analogs.
This might play out like the weakest one here, which saw a lot more consolidation at these levels before eventually flipping the trend.
Pattern detected once again 👁️
Binance rolling out stock trading, “capital rotating out of crypto” 📌
Saylor selling 📌
ETFs posting record outflows 📌
MtGox distributions headlines 📌
A flood of bearish headlines appears all at once, convincing the crowd that the worst is yet to come. Fear spreads, confidence disappears, and people start questioning their positions.
$SPY Here's the consensus paths across top 5 historical analogs for the past 6 months of the index.
Some consolidation in June and throughout the summer to digest the recent gains in Spring, followed by a continuation of the meltup into year end with a price target of >$800.
This pullback is clearing up some uncertainties, as it rules out certain scenarios & clears vision
I think $BTC is in Wave 2 (of higher-lower degree), typically, pullbacks in range betwn 50-61%
If you're looking for parallel channel, it would have to be like this
#Bitcoin
Yes it seems like the principle of variation in full action to me. David highlighted that quite well with his spectrum analysis, over the long run the 80 days cycle seems to be dominant but the 60 days cycle already appeared and could appear again. To be fair I don’t trade these daily cycles but I’m clearly interested in this theory, the weekly cycles also will be interesting to watch and see if the 40w is valid or not.
#Bitcoin Daily TF
🔸The last DSS Bressert Bull cross did not get follow through, we got a bear cross and are back in the oversold area.
🔸RSI and Stoch RSI also in oversold area.
🔸We are testing again the green uptrend started in February.
🔸The broken red downtrend from October last year, could be again retested around 68.5k.
🔸Some confluences in this area to find a local bottom and waiting for new signs of momentum change.