@wacy_time1 You're trying to see gods in the starry sky. Technical patterns aren't just drawings; you have to understand the context and the psychology behind them.
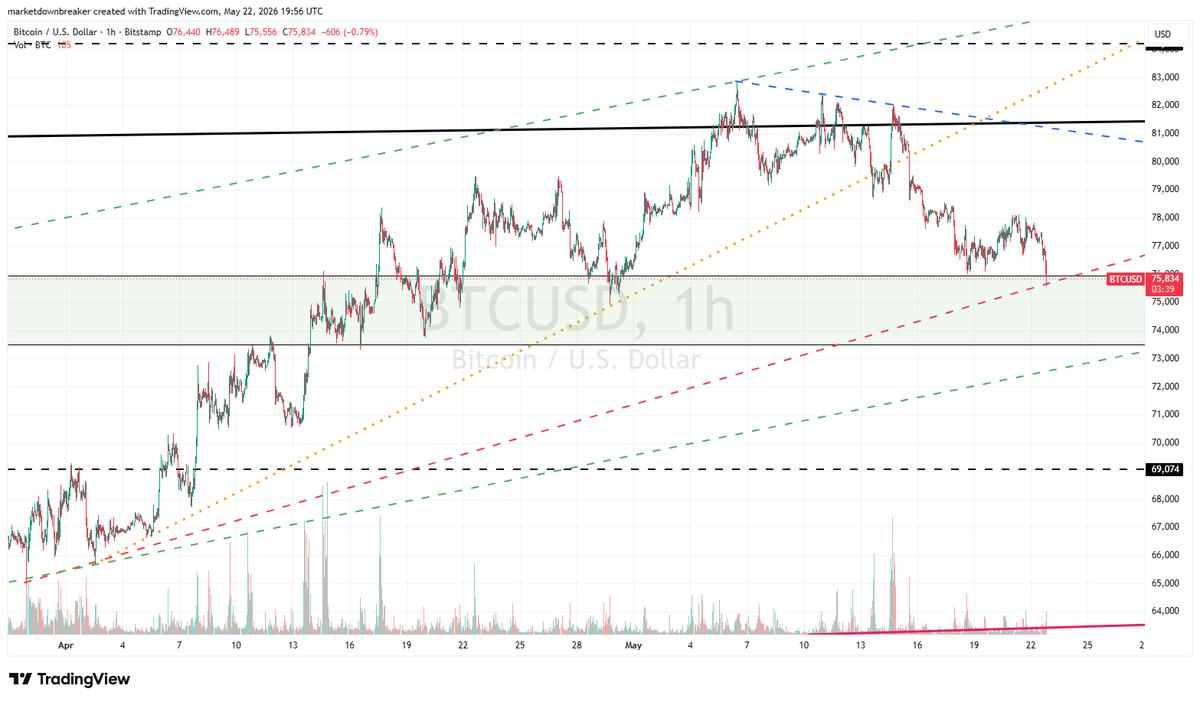
@GDXTrader I think my bearish diamond knocked out your ascending triangle. However, it's true that an ascending triangle can sometimes act as a reversal pattern.
We are seeing a strong rebound in the 20-year bond ETF, returning to the bearish channel. This means the market is rethinking the inflationary impact of the war with Iran, mainly due to weaker PMIs in major economies signaling falling global demand.
Oil is following the "bearish diamond" pattern, matching the initial nervousness after the conflict and strait closure (wider highs/lows), then converging on expectations of more persistent inflation (narrower highs/lows).
@GDXTrader I'm not trying to predict the future, but I agree with you that the limits of your triangle mark the line that separates one fundamental argument from another. In my opinion, given how the macroeconomic situation has developed, I think it's more of a diamond. Just my opinion.
@GDXTrader If it breaks to the upside, in fundamental terms it would mean that the economy is entering a recession due to its implications for interest rates. Should it break down, it would signify an agreement in the Strait of Hormuz and a return to normalcy.
@GDXTrader Okay, let's assume it's an ascending triangle. Ascending triangles are usually continuation patterns, but sometimes they can also act as reversal patterns.
@GDXTrader Trend-changing diamond.💎
- In 80% of cases, the breakout from a bearish diamond pattern is bearish.
- In 95% of cases, the price target of a bearish diamond pattern is reached.
- In 59% of cases, after the breakout, the price pulls back to the resistance level.
@SAMComplete@cryptorover It is very likely that next week we will see an adjustment in the opposite direction. Price adjustment right now is done in a hysterical way with a lot of volatility. Current prices discount the worst scenario.
@AshCrypto Money is flowing from risk assets and long-term bonds to liquid money and short-term debt.
What happens is that the inflation data came out above expectations and the tensions in the Strait of Hormuz do not stop, fueling the inflationary fire.
@WhaleNoName Trying to predict events so far in advance is a recipe for disaster. In the long term (>5 years) the best strategy is to buy and hold. If you trade in the medium term (>1 month and <5 years), you can't try to predict the future, but rather react to the present.
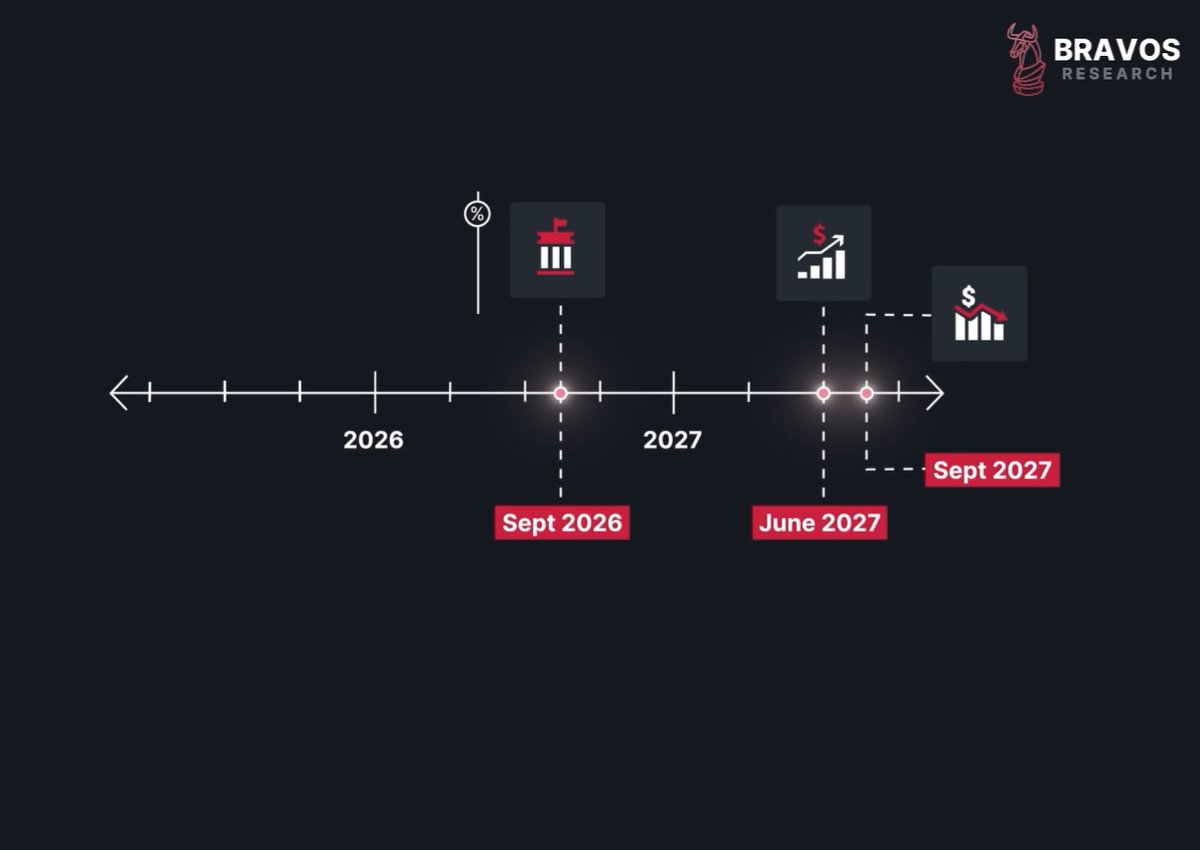
21/ So even if the Federal Reserve begins hiking rates in September 2026, the stock market may not fully feel the impact until June of 2027.
And it might not be until September of 2027 before we actually feel the economic pain on the ground.
@money_cruncher I hope this helps investors realize that following gurus' opinions without understanding why is a bad idea. Follow @ObsidianRisk for explanatory posts with reasoned arguments so you can make your own decisions.
Trump: “Not going to be much more patient” with Iran, expects a deal soon.Tensions rise in Strait of Hormuz after Iran seized a ship and another vessel was sunk. Trump and Xi Jinping meet today amid concerns over the key oil route. #Trump#Iran
We are seeing market concerns shift away from inflation data toward the escalating tensions in the Strait of Hormuz. Oil futures have now entered a price range typically associated with major global economic stress, breaking above the $100-per-barrel mark.
However, we believe that as long as the EUR/USD pair remains within the flag pattern it is forming on the 1-hour chart, this could simply be an isolated rebound driven by current tensions, without any major consequences.