Thanks for following my journey💯
I created a WhatsApp community beyond X to share deeper thoughts on markets, AI, tech stocks, and investing🐳
No hype, no promises — just real ideas, lessons, and growth together🚀
Join here: https://t.co/NQkHo4Gz7c
🚨 $NVDA is approaching a critical technical level.
Nvidia is testing both its anchored VWAP and a multi-month trendline. This is a zone worth watching closely.
⚠️ If support breaks, a move below $200 could come back into play in the near term.
For now, I’m watching price action closely. A breakdown isn’t confirmed yet, but this level could be crucial for NVDA’s next move.
Watch the level, not the noise. 👀
🚨 algorand:native is testing a critical support level.
This is the key zone I’ve been watching, and so far, buyers appear to be stepping in.
Here’s what matters next:
If support breaks: algorand:native could revisit the lower end of its trading range.
If resistance and the descending trendline break: That would be a stronger signal that a new altcoin cycle may be taking shape.
One more factor to watch: $BTC needs to reclaim and sustain levels above $87,000 over the coming months to strengthen the broader market backdrop.
No breakout, no confirmation. I’m watching the price action closely. If the key conditions align, algorand:native could have room to run. 👀
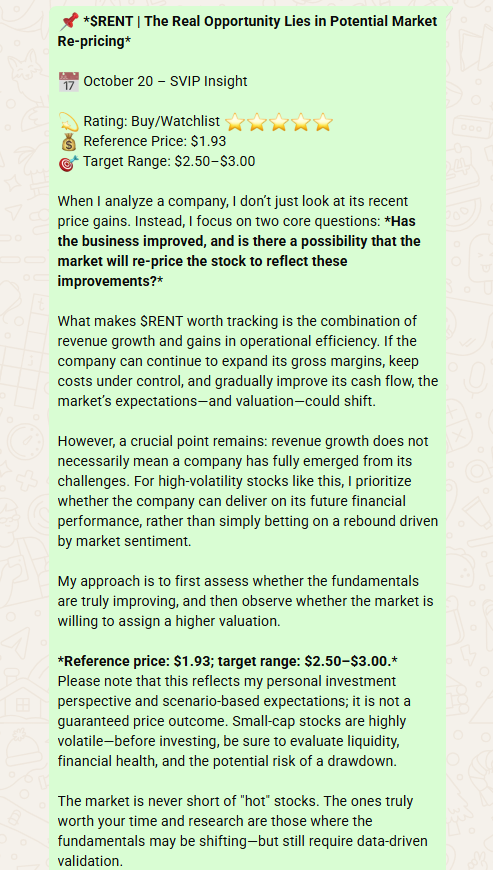
$RENT 👀
On October 20, I shared my $RENT thesis with the group, with a reference entry of $1.93 and a target range of $2.50–$3.00.
The idea was never just about chasing a cheap stock. It was about watching for a potential turnaround and whether the fundamentals could support a re-rating.
Now, the key is execution. A thesis is only as good as the numbers that follow.
I’ll keep watching. 📊
@SerialTrader777 Current market trends are driven largely by sentiment, yet we should not entirely disregard charts. Fundamentals dictate the long-term logic of market developments, while technical analysis helps in identifying key support levels and managing risk
$IREN 👀
Everyone seems bearish right now, but I’m seeing a setup that looks a lot like previous bottoms.
Fakeout, panic selling, golden zone… we’ve seen this pattern before.
Not saying it has to happen again, but I think the downside is getting interesting here.
Watching closely. Let the price action confirm it. 📈
🚨 $MU is at a critical level right now.
Fear is rising, and many are selling. But panic can also create opportunities.
$MU is still in the Fibonacci discount zone, and RSI has made a new low while price hasn’t — a potential bullish divergence.
If support holds, a recovery could be on the table. Bulls may get another shot at $1,000, but confirmation matters.
Watching this level closely. 👀
🚨 $AVGO is approaching a level worth watching.
Historically, when RSI drops below 30 and Broadcom reaches its 100-week moving average, it has marked a potential bottom.
Now, that setup may be forming again.
Not saying the bottom is guaranteed, but I’m watching $AVGO closely. 👀
👀 $INTC is showing signs of a potential reversal.
Holding the 200 SMA + bullish RSI divergence. Two signals worth watching.
If support fails, the overnight gap below becomes critical. Lose that too, and downside risk increases significantly.
Watching these levels closely. No confirmation, no assumptions.
🚨 $MSTR is approaching a critical turning point.
RSI has recovered, the downtrend is weakening, and all eyes are on the 200-day SMA.
A confirmed breakout could open the door to significant upside if $BTC rallies.
Not chasing. Just watching closely. 👀
⚠️ The stock market is flashing a MASSIVE warning signal last seen in 1999.
We've only seen it this high twice... once in 1999 before the Dot-Com crash, the other time was in 1929 before the Great Depression.
The Shiller P/E ratio has caused major crashes whenever it crossed above 30.
Right now the ratio sits at 41...
Economists are insanely wrong about the stock market.
It could deteriorate at any moment.
🚨 $PLTR remains strong, but there is a key risk to watch out for.
Palantir has been one of the market’s top performers, but strong stocks are not immune to pullbacks.
From a technical perspective, there is a gap below the current price that warrants attention. Should the stock fall below its 50-day moving average, it could trigger further short-term selling pressure, potentially leading to a gap-fill or even a test of support near the 200-day moving average.
However, I do not believe one should rush to short $PLTR at this stage. When a strong stock’s trend persists, betting against it carries significant risk.
My primary focus: whether the 50-day moving average will hold.
If it holds, the bullish momentum may continue; if it is decisively broken, the short-term risk profile will need to be re-evaluated.
I will continue to monitor $PLTR closely. I remain cautious in the short term, but I am not blindly bearish—respecting the trend is more important than trying to predict a turning point
My view on $SNDK: the short-term consolidation may not be over yet.
One of the market’s biggest concerns is the competitive threat from China’s $CXMT. As long as these concerns persist, $SNDK could continue trading sideways within its current range.
If the stock breaks below the range low, I’ll be watching the high-volume node below as the next key support level.
In the short term, I’m staying cautious. But my long-term bullish thesis remains intact.
Short-term risk management, long-term conviction. Even when you believe in a company, never ignore the possibility of a deeper pullback. Stay disciplined and trade safe.
🚨 algorand:native bears may be missing the bigger picture.
Sentiment is shifting, and market structure is improving.
Key level now: support + 50-day SMA. Hold here, and algorand:native could break toward upper resistance. 👀
@TSLA_Observer Good question. “Combined” is a pretty broad claim, and it would need clear data to back it up. The point is to question how political family portfolios compare with professional fund managers—not to claim they literally beat every hedge fund without a consistent benchmark
Nancy Pelosi's family has outperformed every Hedge Fund on Wall Street combined.
She has an annual salary of $170,00 but a net-worth of nearly $300 million.
Should this even be legal?
🚨 $SNDK HAS JUST FLASHED A BULL SIGNAL NOT SEEN SINCE EARLY 2025...
Last time, SanDisk went up over 5,000% following this signal.
Not only did $SNDK just hit an overnight gap, but the RSI also briefly hit 30.
The last time it did this was again in 2025, which was followed by over a year of bull market.
Sure, China briefly shook memory stocks... but this is all short-term noise.
Watching this very closely.
🚨 $MU IS STILL WITHIN THE MOST IMPORTANT SUPPORT LEVEL OF THE YEAR
As I said, I expected a reaction from the annotated overnight gap + OTE of the $MU range...
And that is exactly what we are seeing.
If Micron can break above the POC and upper overnight gaps, I think bulls are back.
For now, Chinese competition still causes uncertainty... for all the weak investors, that is.
Long-term? not worried.
Notice: Sold all $CORD holdings today to lock in gains—specific prices have been posted in the group. Retaining cash in preparation for next week’s trading strategy
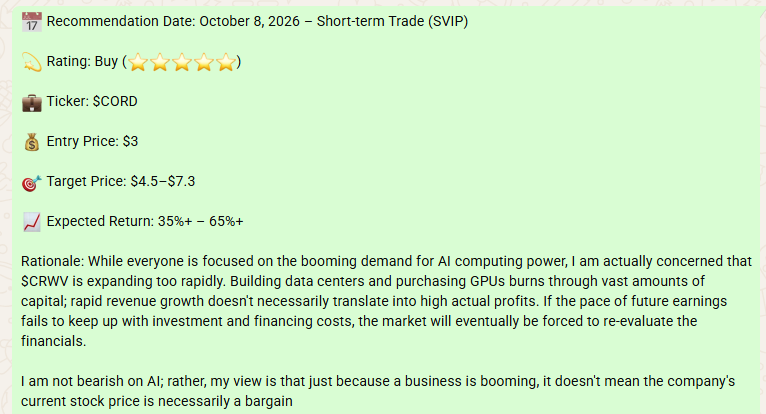
Let’s review $CORD , which I shared on October 8.
Reference entry price: $3
Current price: $4.6
Gain over the period: Approx. 53.3%
My assessment at the time was clear: while the market was chasing AI computing power, I was focusing more on corporate capital expenditure, financing pressures, and whether future returns could keep pace with the investment.
This trade has performed well so far, but I won't let the gains blind me to the risks, nor will I view the outcome of a single trade as a formula that can be replicated every time.
Investing isn't about guessing daily price movements; it’s about identifying opportunities worth researching and then managing risk effectively.
I will continue to monitor $CORD ’s performance.