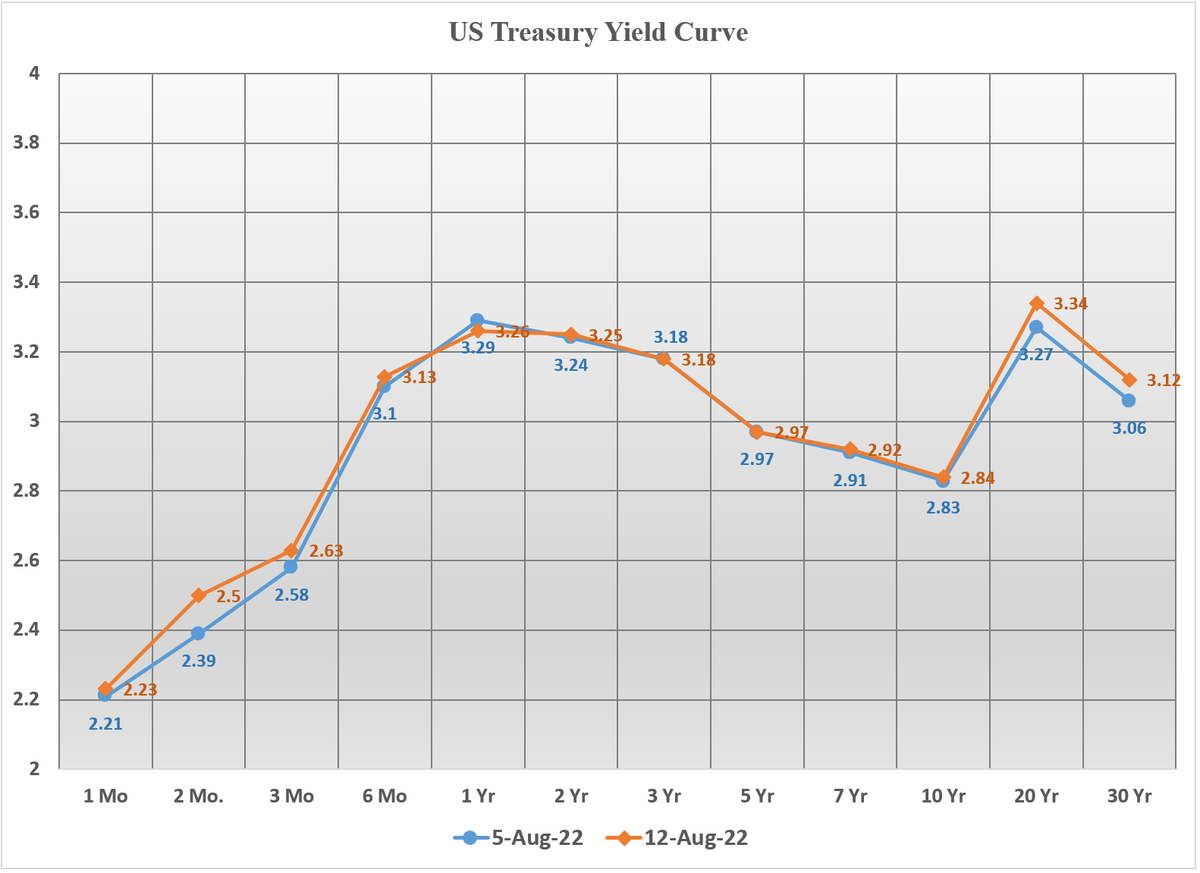
Here is this week's UST #interestrates yield curve compared to the last. This is rare. I call it the Bactrian yield curve. Does it indicate something significant? Not really - except how completely weird these markets are right now.
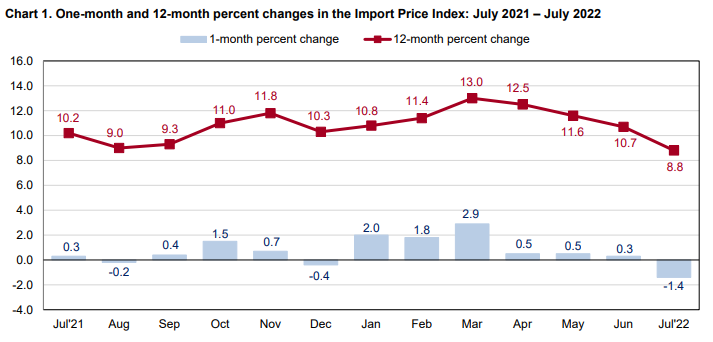
Further softening the #inflation picture, the BLS reported a drop in US July import prices to -1.4%. Much of that is explained by #fuelprices (down 7.5%), but even when that is stripped out remaining import prices fell by -0.5%. This is partly due to the stronger $. BLS graph:
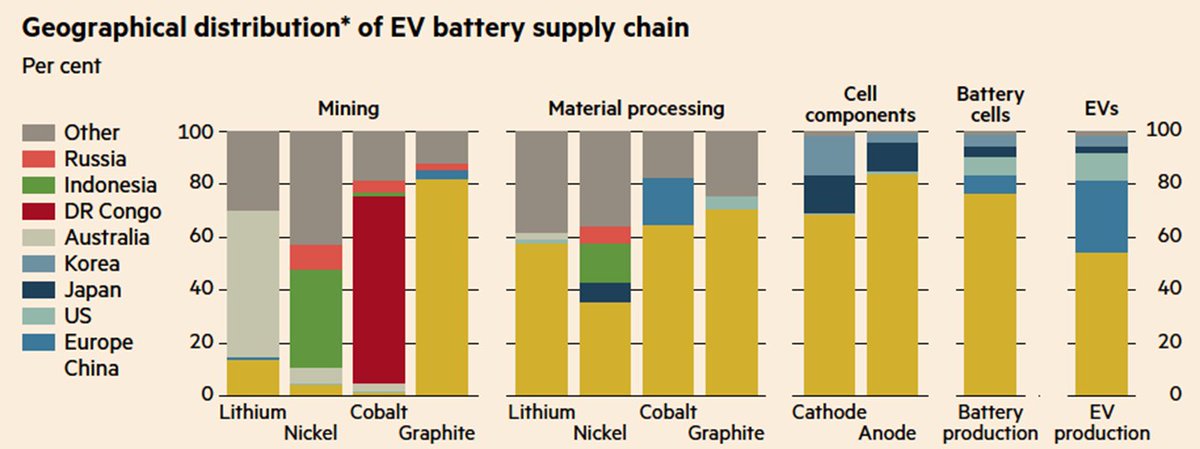
After all, given that we have a policy of exporting our pollution to other countries by insuring that all mining messes are overseas (NIMBY), we will have to stay very friendly with another unctuous, calculating despot to grow our production of #EVs (graph from Financial Times):
What would be the political outcome of $68 winter #natgas natural gas prices if we were paying that price that in the US, especially knowing full well that we could end the trauma by making a single phone call to an unctuous, calculating despot?
European #natgas natural gas prices seem to be on the rise again. Dutch TTF gas December futures contracts this morning were priced at $64.81 per mmBTU, in contrast to US Henry Hub same month at $8.83, also very high, but look at the difference. And Winter is Coming.
The UST 30-year #Bond auction came in at a median yield of 3.019%. HOWEVER, of the $34.282b offered, $21.9 was competitive bid, but $13.282b was SOMA, the #Fed bond-buying program (although $84.8b SOMA are expiring on Aug 15). Complicated? $TLT plunges below 114.35. Puts are sold
The $21b 30-year UST #Bond auction is today, with results at 1:00 ET. I note this AM that $TLT has plunged to below 115.50 even though yesterday it was above 119. Is this in anticipation of the auction? I have $TLT Aug 19 116 Puts that I just put on the market (limit order sell).
This weeks #CPI and #PPI#inflation data may indicate that inflation has peaked, but we have to be cautious. The price indices can be very volatile - especially the energy components. Oil and Gas may have peaked, but the slightest political twist can send them soaring again.
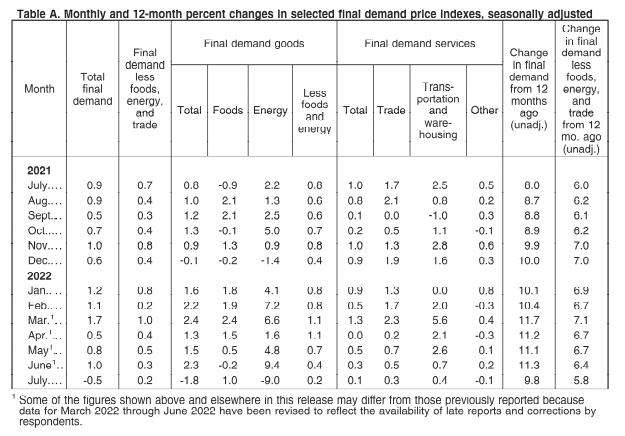
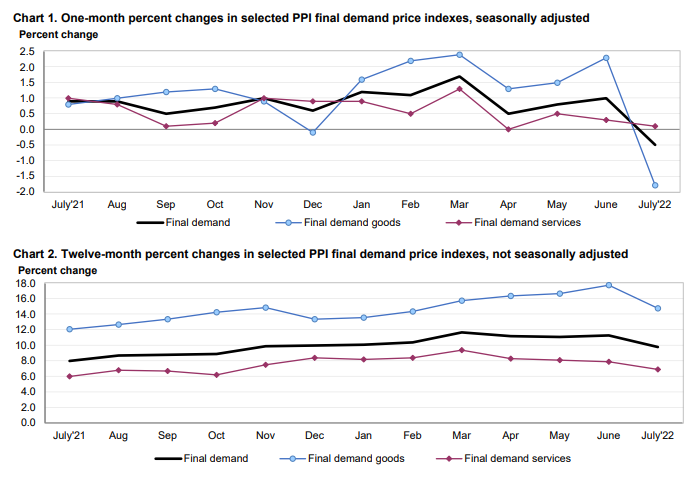
The new #PPI numbers show some complexity. The decline in final demand prices of 0.5% is because of the energy component falling by 9.0%! Foods rose 1.0% and Final Demand less food and energy rose 0.2%. Another BLS chart from today's report:
Correction: I posted a mistake yesterday about the CPI when I wrote this: "The monthly July rate was 1.3% same as June." The monthly July rate was actually 0.0% because of the substantial fall in energy prices. Apologies.
Producer Price Index #PPI#inflation numbers for July reflect the same price improvement as seen in yesterday's CPI. The June-to-June annual rate for Final Demand was 9.8% but the one-month change for Final fell 0.5% compared to 1.0% for June, BLS graphs:
The monthly UST bellwether 10-year Note auction ($35b) will be concluded today (Wed) at 10:00 AM ET. We will see if these new #inflation numbers impact the yield of the note (last month median yield was 2.85%). Notable that nearly $85b SOMA (#Fed bond inventory) also mature.
Because the overall #CPI#inflation numbers are generally below expectations, the market is treating this as a bullish sign (prior to the open). To me it indicates that possibly inflation has topped, although there is a long ways to go before inflation is restored to targeted 2%.
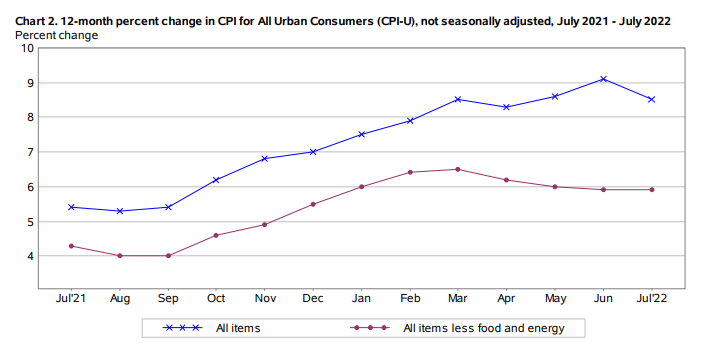
July #CPI#inflation numbers: The Jul-to-Jul annual rate for all items rose 8.5%, down from 9.1% in June. The monthly July rate was 1.3% same as June. Core rate (no food and energy) rose 0.3% compared to 0.7% in June, 5.9% for last 12 month. BLS graph:
Markets this week react to #inflation news, most notably the #CPI Consumer Price Index on Wed, but also the Producer Prices Indices on Thur, and Productivity and Costs Tue, and Import/Export prices Fri. On the CPI, expect the overall to abate (lower energy) but the core to rise.
There is currently a flight out of nearly every yield-bearing asset that exists, from emerging market, overseas and domestic junk, even investment grade, into Treasuries. Nonetheless, #interestrates on Treasuries cannot persistently stay below the underlying #inflation rate.
Look how much the US Treasury #interestrates yield curve has flattened in the last two months. Notable: (1) the unpopular 20-year bond remains a bizarre anomaly, (2) aside from the 20-year, the 1 year note trumps all. Believe me, this story is not over.
So how to you reconcile the fact that we are in a recession with today's job numbers? Essentially everyone who wants a job has a job BUT because of inflation their real wages are falling, so they (and businesses) have to cut back on select categories of spending, so GDP shrinks.