I spent years developing Metcalfe's Law as a model for Bitcoin's Value; much more work than has been made public.
It's not just a theory. Researchers and practitioners called it "influential analysis" that "remains the point of reference" for Bitcoin valuation.
Applying Metcalfe's Law to Bitcoin is complicated. I had to devote 3 chapters to it in The Bitcoin Investment Handbook. It's not wrong, and it's not a curve fit. In fact, it has been a reliable leading indicator of price for over a decade.
You can track it daily at https://t.co/tcnp3kJLT4
You can read about how it works in detail at https://t.co/KuUR7vN2u6
You can download the free paper at https://t.co/kGDMfoqS7e
This is crazy.
Short sales have outpaced long buying by a staggering 5:1 month-to-date, pushing short leverage close to five-year highs.
We have 44% of all earnings next week including loads of tech companies.
If the Nasdaq can hold the range into earnings and we see some surprises, that's a monster amount of fuel for a squeeze.
Good things happen to altcoins here.
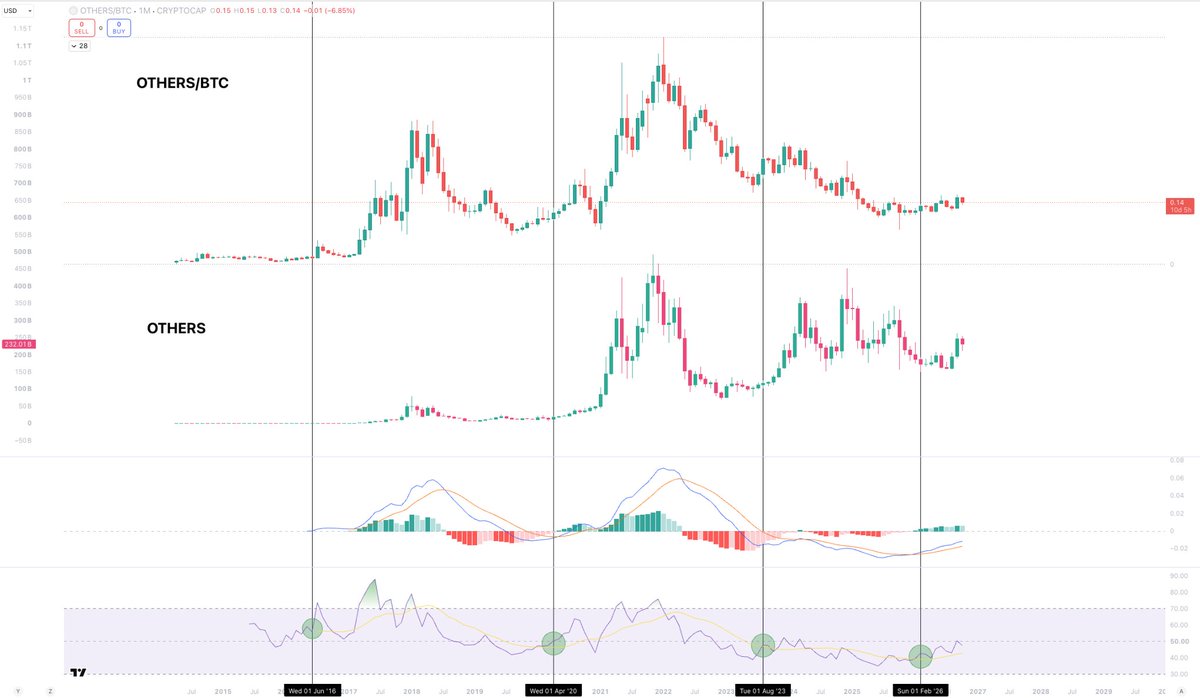
Whenever the 1M RSI for OTHERS/BTC crosses bullish, it has marked the start of the largest periods of altcoin performance.
Altcoins have been in a bear market against Bitcoin since the 2021 top.
The run we had in 2023 was a very small bear market rally for OTHERS/BTC.
That has now shifted, however.
Altcoins are gearing up for only their third true period of outperformance against Bitcoin through the entire Crypto history.
You don't really want to be fading it anon.
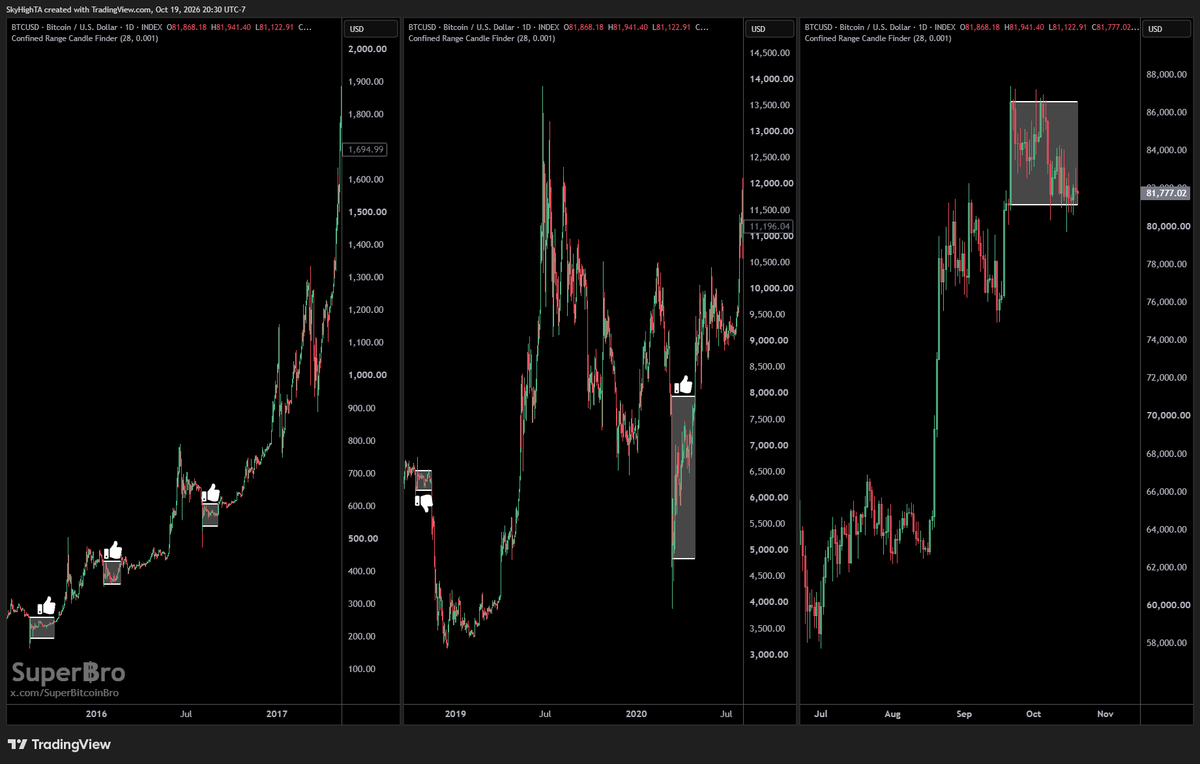
$BTC has now closed 28 days inside the body of one daily candle.
This is extremely rare. It has only happened 5 times in bitcoin's entire history.
Look closely and you will see that it has never had a false breakout from one of these ranges. In other words, it has always continued in the direction of the initial break.
If this pattern continues, then right here near the bottom of the range is about the best R/R you are going to get, and the ensuing move is likely to be massive.
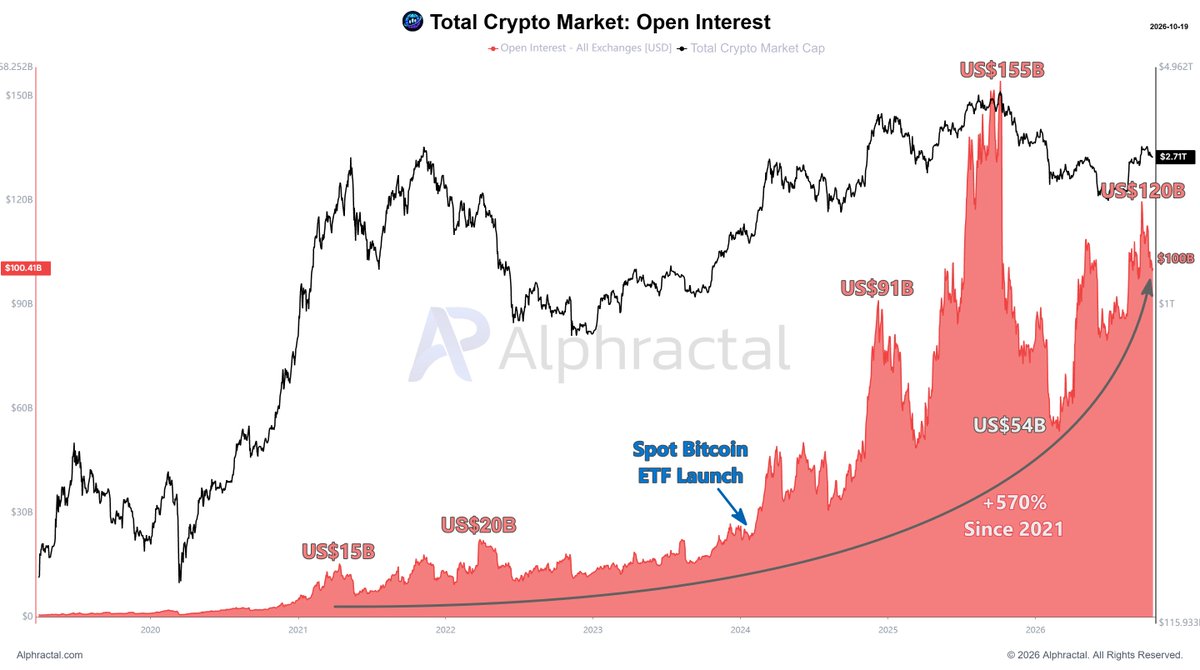
The 5-Year History of Open Interest in the Crypto Market!
The cryptocurrency derivatives market has undergone an incredible transformation over the past five years.
In 2021, total Open Interest across crypto exchanges was approximately $15 billion. In 2022, it reached around $20 billion before experiencing a significant contraction during the bear market.
In January 2024, we witnessed a historic milestone: the launch of Spot Bitcoin ETFs in the United States.
Following this event, the derivatives market experienced remarkable growth, accompanied by greater institutional participation, increased liquidity, and rising interest in leveraged positions.
Open Interest surpassed $91 billion in 2025 and eventually reached an all-time high of approximately $155 billion!
After a massive deleveraging event that pushed Open Interest down to around $54 billion, the market recovered, climbing back to $120 billion.
Today, total Crypto Open Interest stands at $100.4 billion, approximately 570% higher than its 2021 levels.
Bitcoin alone accounts for $42.6 billion, representing 42.4% of all outstanding positions across the crypto market.
These numbers highlight how much the market has evolved and how derivatives have become an increasingly important part of the crypto ecosystem.
But there is one crucial detail: higher Open Interest also means greater exposure to sudden market movements, deleveraging events, and cascading liquidations.
The market has grown. Leverage has grown with it. And understanding the data has never been more important.
this chart should scare the shit out of anyone trading meme coins.
DOGE reached nearly 90B. SHIB 40B. PEPE over 10B. yet today we’re celebrating new runners hitting 1M.
imagine running a casino where you add thousands of new tables every day without bringing in more gamblers.
more tables. same players. less money at each table.
eventually nobody wins enough to keep playing.
that’s exactly what dilution is doing to the trenches. we don’t have a shortage of memes, we have a shortage of concentrated demand.
pump pairs could fundamentally change that.
instead of thousands of disconnected launches competing for liquidity, imagine activity concentrating around 5 major ecosystems.
new tokens can trade against established assets like solana:Hg5Ja55T5wESq4vyFoiVCMeHXtGyVA69X2UHq8hgpump instead of SOL. $50 jeets chase microcaps, midcap traders buy established betas, and size whales deploy into deeper parent assets.
different risk appetites, same connected economy.
but the biggest shift could be how the market values these coins.
right now, traders anchor to the last runner. if yesterday’s winner topped at $1M, suddenly $1M becomes everyone’s perceived ceiling.
what happens when traders start valuing new memes relative to their parent ecosystem instead?
imagine PUMP at 3B, BATON at 300M, and a BATON beta at 30M.
each just 10% of the layer above it. not price targets, but a completely different valuation framework.
suddenly a $5M beta isn’t being compared to yesterday’s $1M runner. it’s being compared to a $300M parent.
the benchmark changes, and so does the perceived ceiling.
there’s also a natural pricing relationship. if BATON rises while a beta maintains its BATON exchange rate, that beta rises in dollar terms. BATON trading against PUMP creates the same potential dynamic upstream.
stronger PUMP, stronger BATON, higher dollar valuations for successful betas.
a rising tide can lift all ships, provided relative demand holds.
and the economics go beyond price.
new pairs can route activity through BATON and generate fees in the paired asset. successful launches can attract more traders, liquidity and builders. increased platform revenue can also support PUMP through pumpfun’s buyback-and-burn mechanism.
more successful launches create more activity. more activity strengthens the parent ecosystem’s network. stronger ecosystems attract more capital and launches.
instead of constantly fragmenting liquidity, activity has a chance to compound.
so why BATON over other pump pairs?
BATON has the original pumpfun lore, was the first coin paired with PUMP, and is already positioned as a parent asset for new launches with 700+.
anyone can create another pair. they can’t recreate being first, and building an established network of traders, liquidity and communities takes time.
it’s the same principle behind Ethereum’s moat. the advantage isn’t simply the token, it’s the economy built around it.
if pump pairs become the structure that consolidates the trenches, BATON has a legitimate shot at becoming its flagship.
the next big meme winner might not be another isolated 100x. it might be the ecosystem that hundreds of potential 100x opportunities build around.
we don’t need fewer degens or fewer launches. we need fewer disconnected economies.
pump pairs could be the structural shift this market needs.
$BATON could become the face of it.
because if we keep adding supply without giving capital a reason to stay, every new runner will keep fighting over a smaller piece of the same pie.
The dollar has completed the perfect 3 drives into the fibs 1.272 and started to correct.
Despite all the negative headlines, price simply went for a test of that level and of the upper band of the channel, but no breakout whatsoever so far.
For the moment I will keep an eye on a retracement back to the last S/R level and see how we move from there.
But so far the 3 drives are too clean to neglect, so a bigger retracement is definitely on the table, allowing risky assets to breathe a bit.
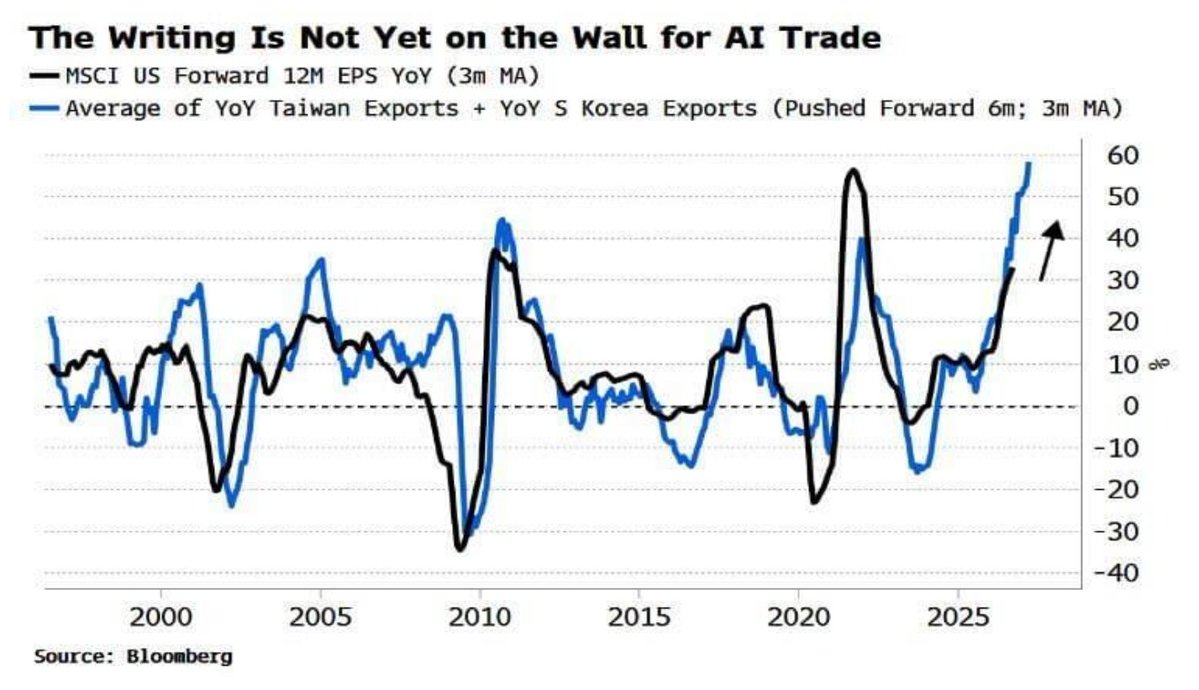
Finally, a forward looking indicator for the markets.
Taiwan and South Korea Chip Exports Lead US Earnings by 6 Months; No Downturn Signal Yet
The average of Taiwan and South Korea export growth, pushed forward six months, closely tracks MSCI US forward 12-month EPS growth.
Both countries are "significant producers of the chips that are the foundation of the AI investment boom" and are released monthly, with South Korea publishing a 10-day estimate around the 21st of each month.
Chip exports are "likely to detect the pullback with about a 3-6 month advance."
Crucially, as of the October 15, 2026 publication, "South Korea and Taiwan's exports currently give little sign that the investment cycle is imminently about to turn down."
When they do turn, that's also a cue for yields to decline since chip exports lead nominal GDP as well.
Overlay Bitcoin's 2022 bottom with the June 2026 bottom and they're basically TWINNING 👯
- - -
We're sitting right about where Bitcoin was in late February 2023. That spot led to one last shakeout and then a real breakout.
It's only a rhyme, but it's a hard one to ignore, people 🤷♂️
Major coins that outperformed BTC over the last year: 27%
Major coins with buyback mechanisms that outperformed BTC over the last year: 61%
Since the FTX lows? 50% vs 24%
It’s hard to outperform BTC but if you wanna try, start by looking for coins that perform buybacks
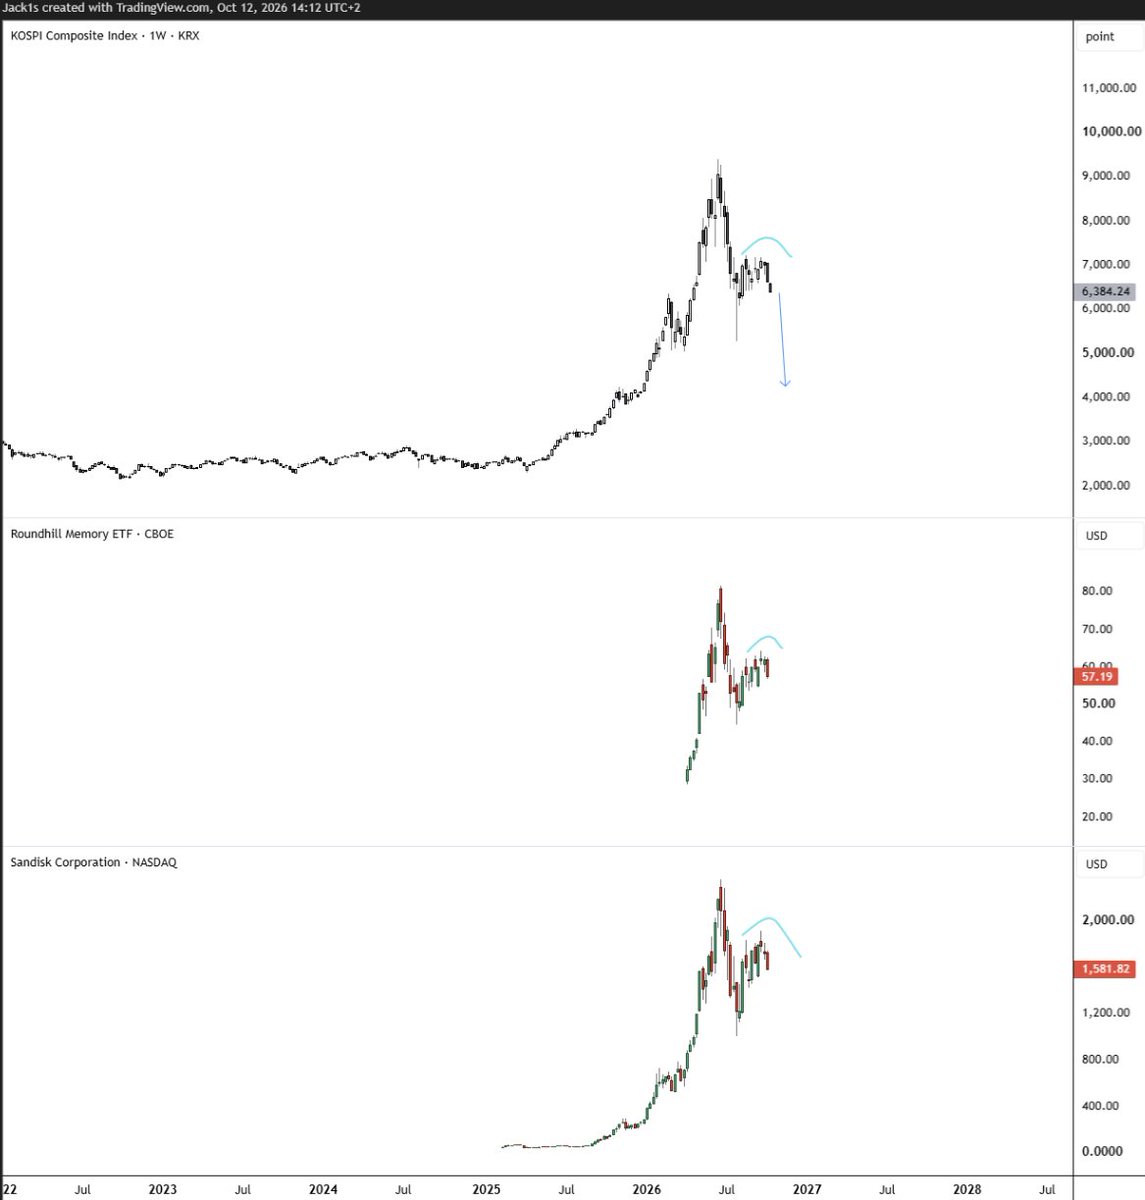
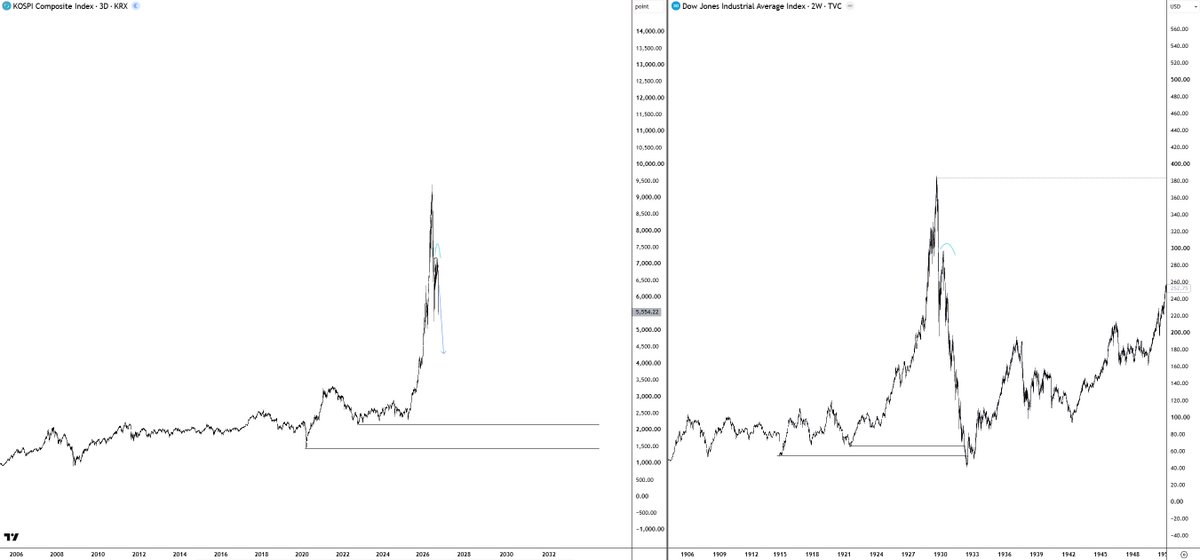
A chart discussed internally on Monday in regards to Memory ETF, Kospi index & SNDK. But also works for Micron and so forth.
The whole memory market got a typical parabolic run in which market participants thought that it will go like this forever and everyone can get rich.
As it is typical most get in near the top, and many have done so on high leverage, then the market cleanse itself with a quick sell-off but much bigger than all previous ones, usually retracing 50% of the move or so.
After all the liquidations hit in, bounce comes in & all the people who bought think:
"The market just needed to cool off, my investments are with good companies. They will come back"
But the buyers are no longer present. The bounce takes a lot of time with the inability to push it much higher. And buyers give up.
All the people that FOMOed are facing a tough decision. To sell at a loss now or hope it bounces back up.
Those lucky one who got in early are also facing a tough decision.
"I already 2x my money & now I'm back at B/E. I don't want to give all my profits back to the market."
In most cases market participants keep on holding, hoping things get better. They don't. At least not until much later on.
Nobody knows the future but the aggressive selling taking place is a lot telling.
New circuit breakers coming shortly.
Panic imo kicks in sub 5000 on Kospi.
Not saying this happens but seeing lots of similarities with DOW from 1929.
"Everybody is a genius, we are all going to make it".
People who have real knowledge, experience & track record for the past 30-50 years are getting mocked.
TA wise, similar too.
When you want to buy a RAM memory for your PC it costs 3x what it used to just a two years ago. Literally the same thing during the 2017 crypto parabolic run...
Everyone mined crypto back then buying all the graphic cards availiable at that time. They were so expensive even regular gamers complained.
Same story. Different market.
I pulled every US election since 1950 and checked what happened to stocks, gold, oil, the dollar and Bitcoin.
The cleanest pattern in the whole study:
The S&P 500 was higher 12 months after every single midterm. 19 out of 19.
Unified government or divided, it didn't matter.
Midterms are on November 3. Full breakdown with all the tables in the article below.
Just keep it simple.
1. 1W RSI Oversold
2. Cycle Bottom Confirm
3. Bull market confirm
4. 1W Supertrend Bullish
5. 1W 50SMA reclaim
6. Monthly higher high
Regardless of dips, which are inevitable...
The above is the confirmation of total market structure shift.
Until that changes, and things shift back...
We are HTF bullish.
It is that simple.
Don't fight the trend.
Gold likely to remain a better investment than BTC over the upcoming months, with broken structure and trading below mid range.
BTC has not been able to outperform Gold for 5 years.
Bull market in commodities has started
ETH just recorded the highest number of Binance withdrawal transactions ever. more than 320,000 withdrawals in a single day, and it happened while $ETH was correcting.
that’s the interesting part, price was weak, but instead of coins rushing onto Binance, activity exploded in the opposite direction.
record withdrawals during a selloff is a bullish signal.
Is #Bitcoin bottomed & we are heading for a new raging bull market?
Or is this a Bear Market rally before new lows?
Let’s find out. A breakdown full of data. https://t.co/3UFpu2fx3d