NEW PAPER: We tested 68 regressions predicting light attenuation across the #GreatLakes. Using these with ecosystem models improves modeling and understanding of whole lake ecosystem dynamics. Regressions are available in ESM.
Open access in JGLR @IAGLR.
https://t.co/DKFT89lGwf
Ok. I guess I have to address this. The information on your phone app comes FROM data provided by NOAA for free. NOAA gathers weather data (daily balloon launches) and feeds it into the modeling so your phone can tell you it's going to rain tomorrow. Saying we don't need NOAA or the NWS because I can see the weather on my phone, is like saying we don't need farmers because I can just go to the grocery store. End of rant. You may continue scrolling....
Using meteorological records, @NWSMarquette, @NWSCLE, & GLERL scientists modeled the weather conditions & wave heights that caused the tragic #EdmundFitzgerald wreck. At the height of the storm, modeled waves peaked around 25.5 ft (7.8 m).
https://t.co/hdCm3cpbtv
#LakeSuperior
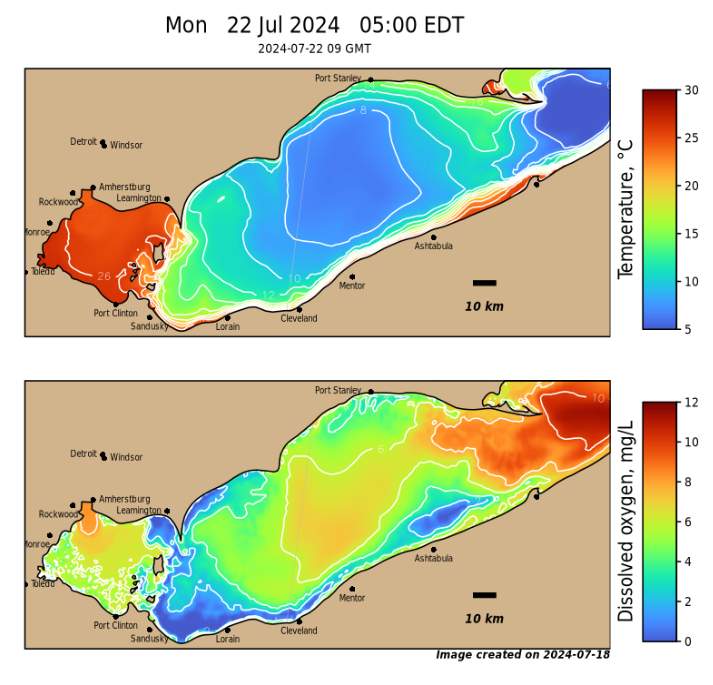
#LakeErie provides drinking water to over 2 million people, but hypoxia (low oxygen in the water) can disrupt the water treatment process.
NOAA’s newly operational Lake Erie Hypoxia Forecast predicts these hypoxic events, helping keep drinking water safe! https://t.co/iPJkfrSkJt
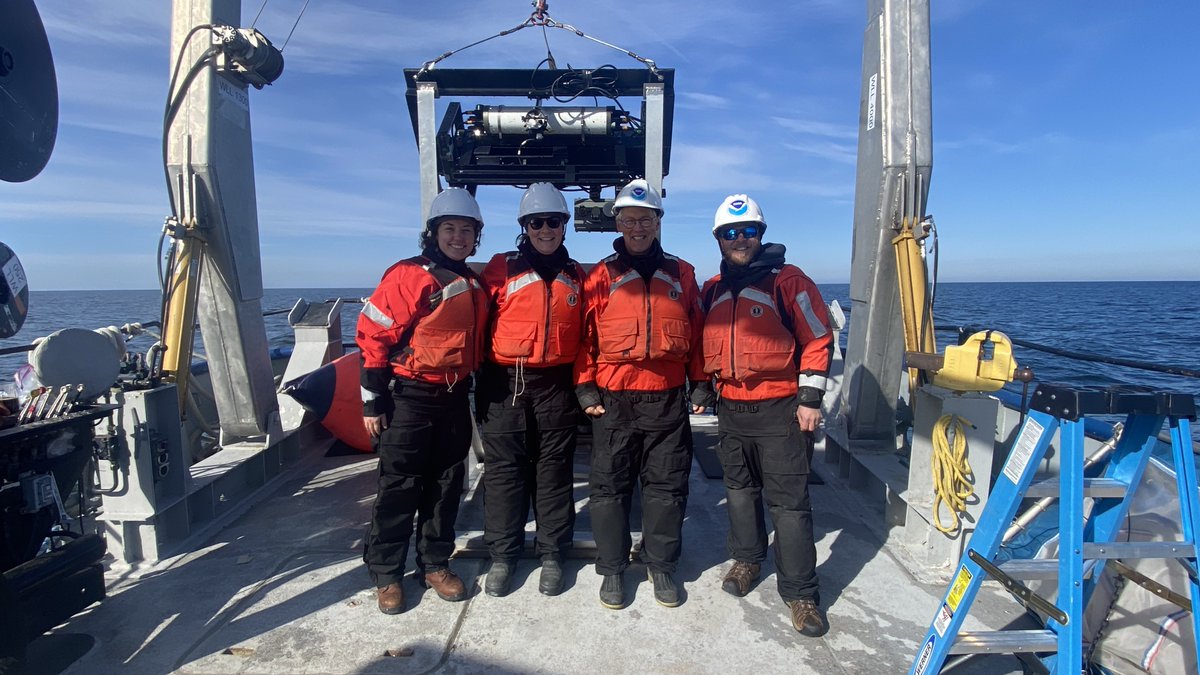
GLERL & @ciglr_um ecologists have been hard at work testing high-tech sampling tools in #LakeMichigan! This MOCNESS (Multiple Opening & Closing Net & Environmental Sensing System) enhances our ability to observe the dynamics of #GreatLakes ecosystems over space and time.
🚨 #CIGLR is #HIRING, Plz SHARE! We are seeking TWO Research Engagement Specialists, who will engage w/ stakeholders & rights holders in the co-design of #GreatLakes research that will lead to socially useful research products. #GreatLakesSci More & Apply: https://t.co/Z3T1wMOlfK
#TBT: As the 2023 #LakeErie hypoxia season begins, here's a look back at hypoxia in 2022! This animation shows model-predicted bottom temps & dissolved oxygen from the Experimental L.E. Hypoxia Forecast w/ observations (circles/squares) plotted over top.
https://t.co/ePwMY39ZsZ