#ROI annual update: bottomed at -93%, recovered to -58% last year, now at -40%. Recent pullback from a +22% ATH came from excessive exposure to high-volatility stocks with leverage. Lesson learned. System adjustments in progress. Still building. Ready for 2026!
#ROI update: from -93% bottoming 13 months ago to -58%. Learning from losing and winning trades, improving and building my system step by step with discipline, perseverance and consistency. Ready for 2025!
$QBTS might look extended after +6300% since the May 2023 cyclical low, but the stock is only +90% vs its pre-IPO top 4 years ago. Massive multi-year accumulation base.
$QBTS broke out of a 3-year post-IPO base (weekly), now showing early bullish RSI divergence (daily). Meanwhile, QTUM ETF just tagged a closing ATH after a V-shaped recovery.
Interesting contrast between websites language and market structure.
$APLD homepage talks about ‘forged’, ‘discipline’, ‘execution’, ‘built to last’ → powerful stage 2 uptrend and exploding RS.
$ACN talks about ‘reinvention’ and ‘constant change’ → severe stage 4 breakdown and collapsing RS.
When price action reflects corporate psychology.
$APLD monthly view update: consolidating above the 40-week SMA and around the 2021 bull market top breakout zone, after building a massive 4-year base. Holding spot position since Sep 2024. Added new 5x leveraged longs 3 weeks ago at $28.39. Bull structure remains intact.
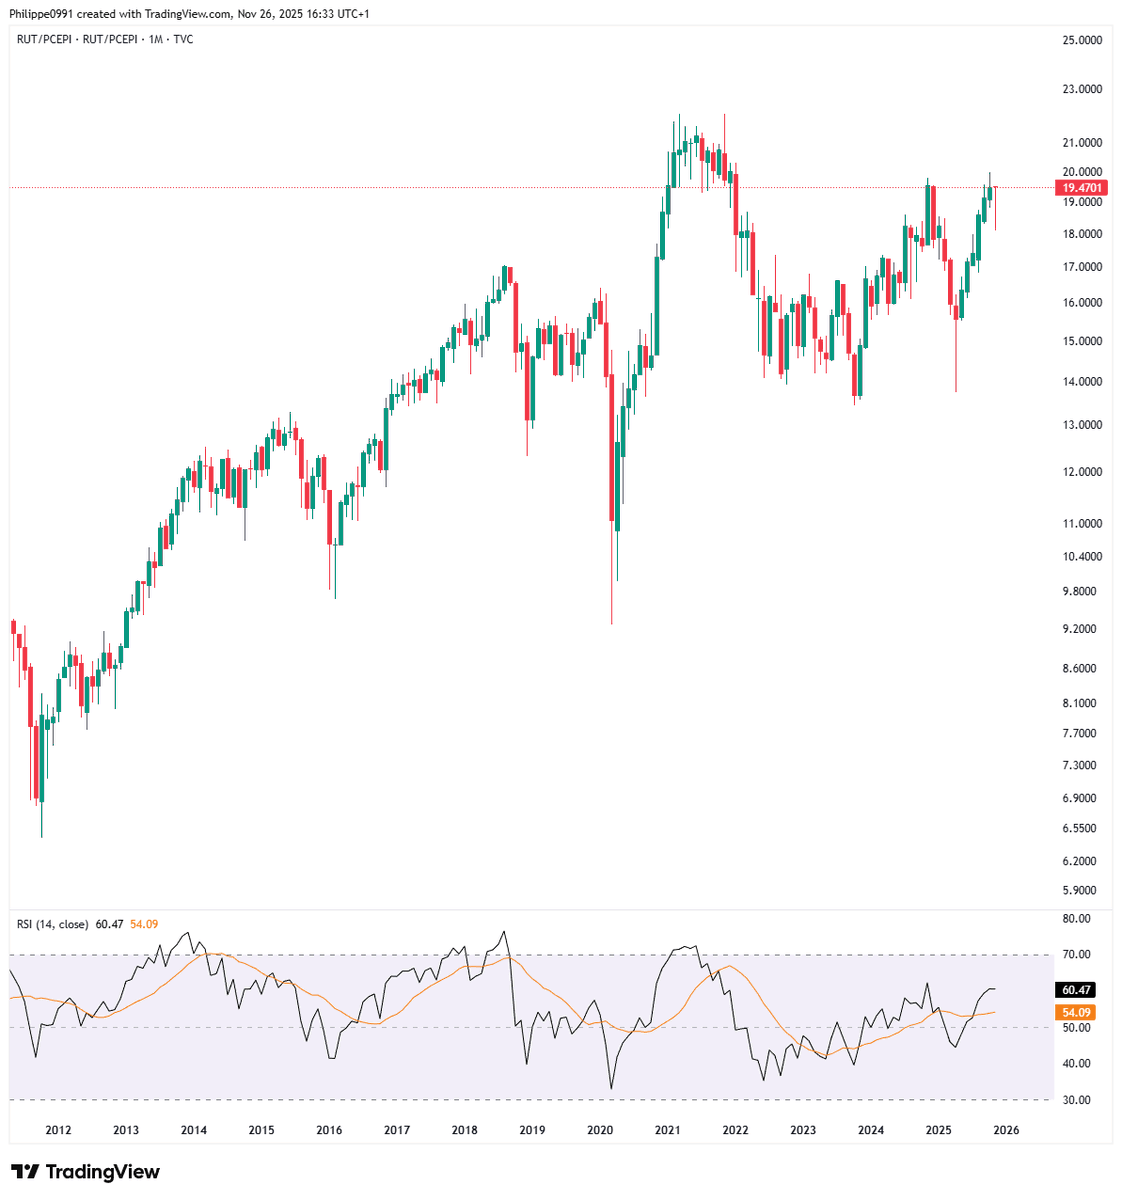
Russell 2000 / PCE massive cup and handle.
Small caps outperforming the Fed’s inflation gauge = real breadth.
Far from overbought — upside potential remains significant.
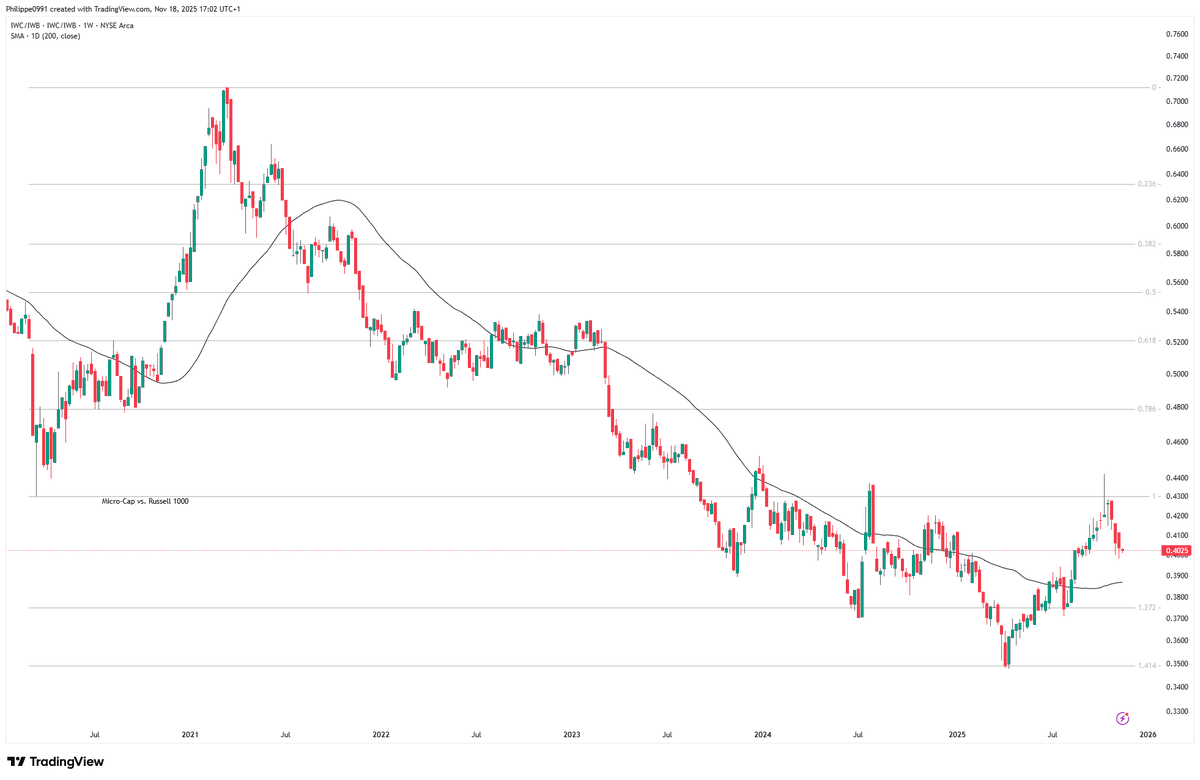
Micro-caps vs large-caps are basing after catching support right on the 2020–21 bull-run 1.414 Fib extension — with the 200-day moving average starting to turn up.
Russell 2000 / PCE massive cup and handle.
Small caps outperforming the Fed’s inflation gauge = real breadth.
Far from overbought — upside potential remains significant.
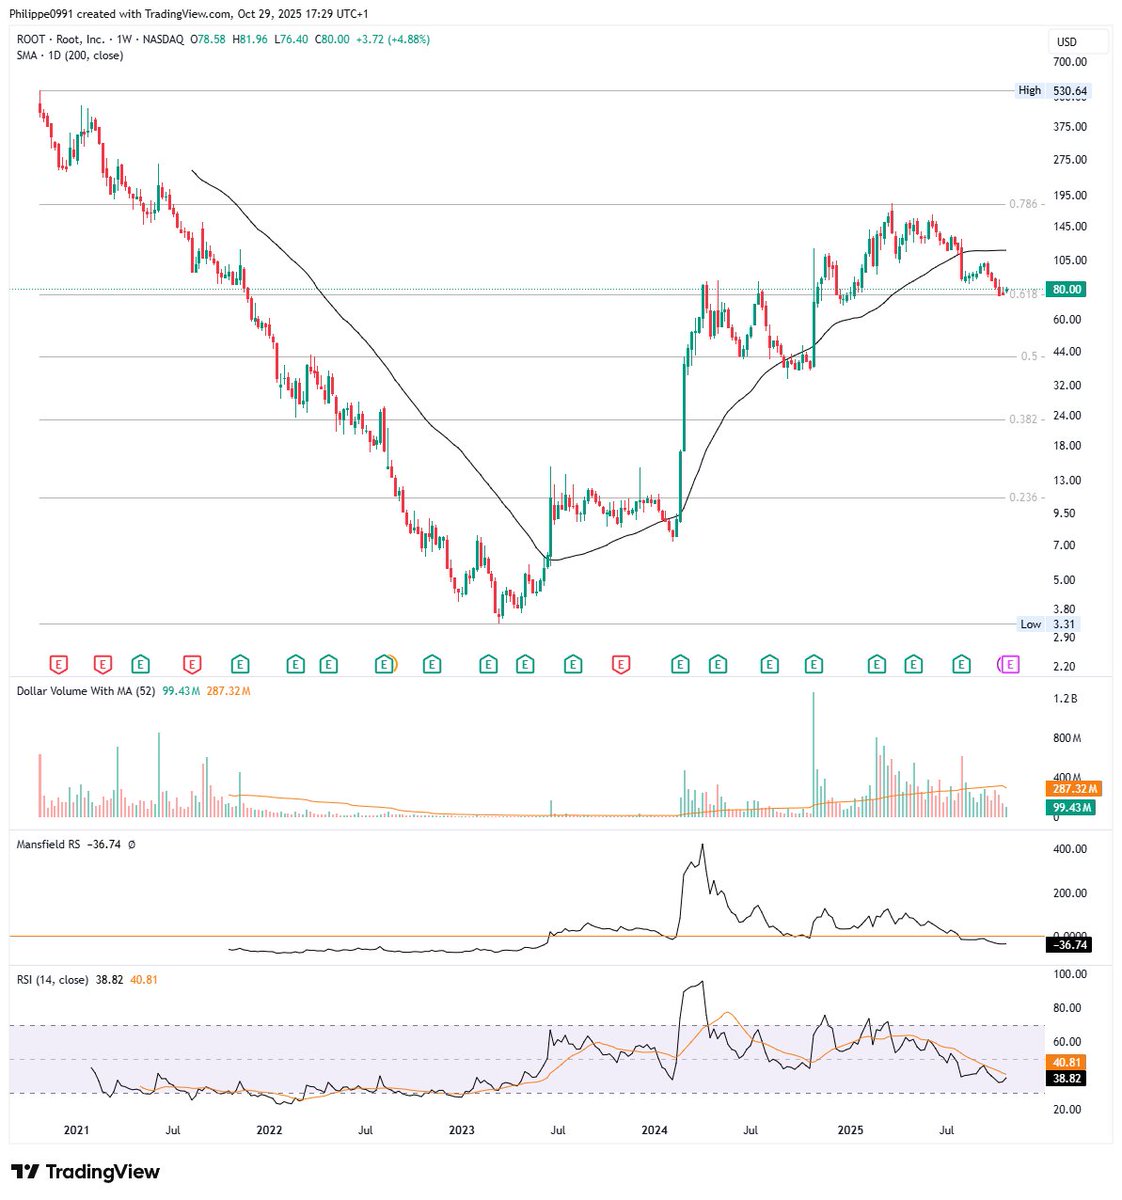
Closed $AFRM with an average +80% P&L. Rotating into $ROOT — weekly setup. High volatility name, strong relative strength. Spot exposure + 5x leveraged line.
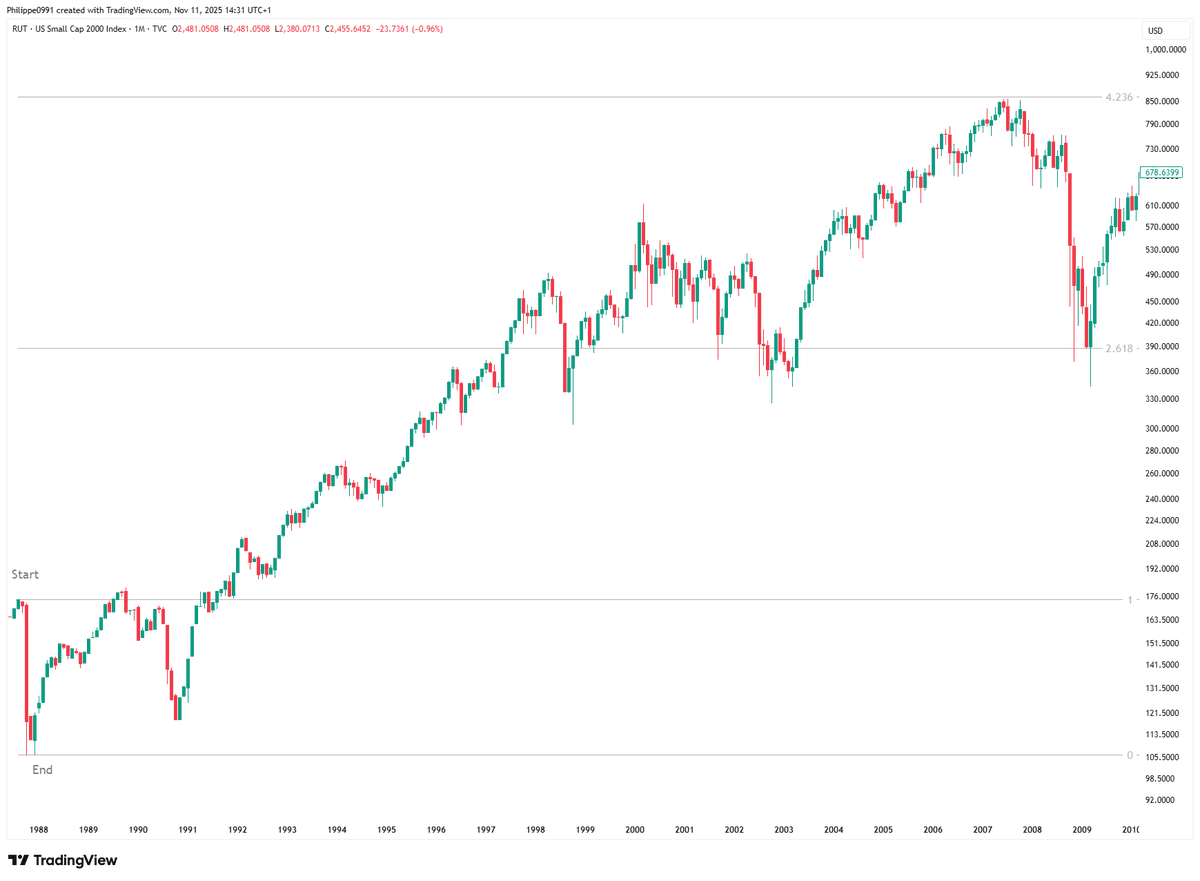
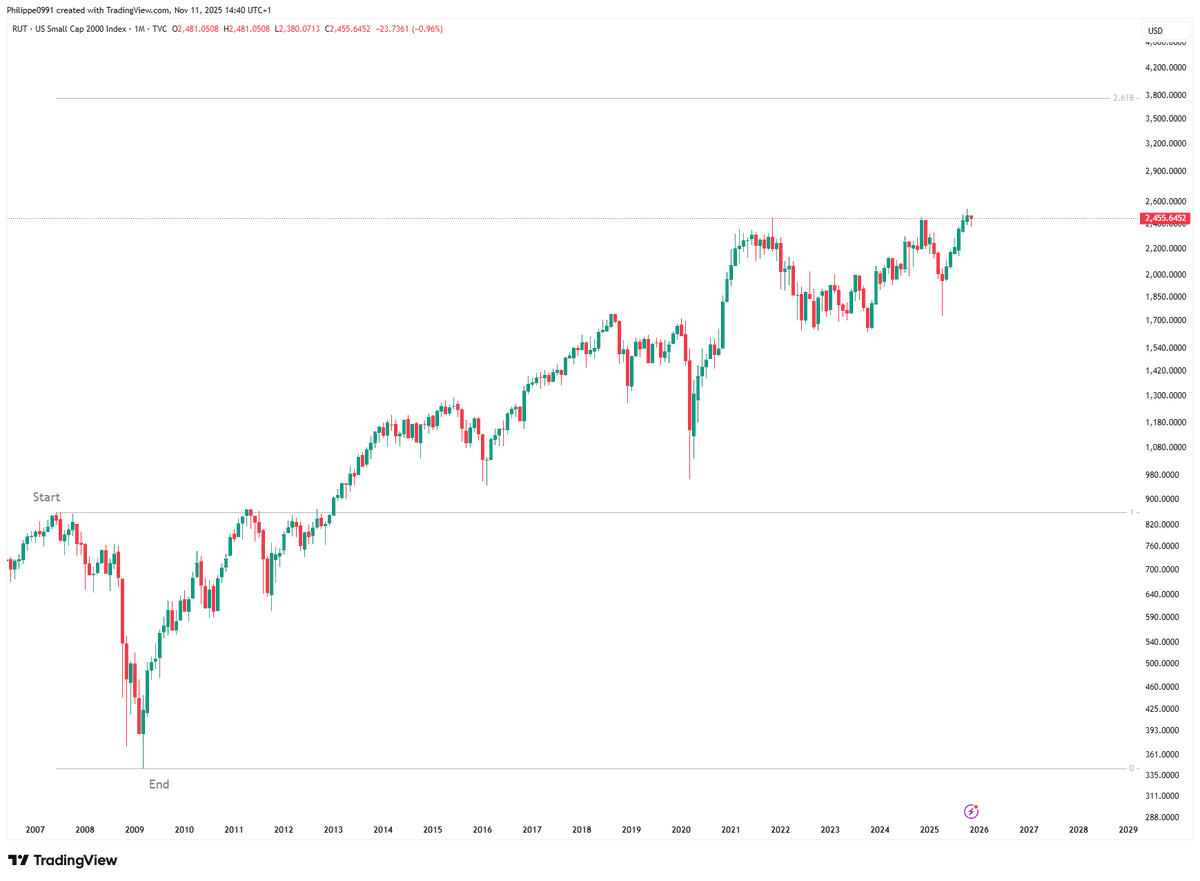
🔎 Russell 2000 $IWM – Geometric Recurrence
Each cycle completes with a defined expansion before reversal. Symmetry dominates. Fractals repeat. The latest structure remains incomplete.
#SmallCaps#MarketStructure#Trading
Current exposure aligned to capture the V-bottom recovery on stocks markets and BTC’s new ATH (already secured some profits into strength). 11% cash on hand — ready to absorb any correction and fire on fresh setups.
Ahead of my flight for holidays, I’m running both a social and a technical experiment: staying sharp by reading the @FT - one of the papers I usually scan online every morning.
Refreshing to digest market data without screens, just ink on paper, in the most globalist of places: an airport terminal, where the perpetual flow of travelers to everywhere and nowhere mirrors the perpetual flow of global liquidity.
A glimpse of what it felt like to research as an investor before the digital age.
Russell 2000 retracing to the 0.5 Fibonacci level (Oct 2023 low - Nov 2024 high) and testing the former resistance of the 2022-2023 accumulation base. Its relative strength line printing higher lows is adding confluence to a potential bottom. The first index to top could be the first to bottom and lead the next bullish move 🚀 #RUT