Happy Birthday, Rosalind Franklin! We celebrate her work and influence in science. Thanks to her, we have the historic Photo 51, which revealed that DNA has a double-helical structure!
🧠Las pruebas estadísticas comunes son modelos lineales
¡Deja de aprender #stats como una secuencia de modelos desconectados!😝
👇Esquema con los modelos lineales subyacentes a las pruebas paramétricas y no paramétricas habituales: https://t.co/LKcEQfAGkP
#datascience#analytics
Interpreting and Reporting Odds Ratios (OR) and Hazard Ratios (HR)
1/ Introduction:
Odds Ratios (OR) and Hazard Ratios (HR) are common metrics in epidemiological and clinical studies. They help us quantify associations between exposures and outcomes. Understanding and correctly interpreting these metrics is essential for drawing meaningful conclusions.
2/ Odds Ratio (OR):
The OR represents the odds of an event occurring in one group versus the odds of it occurring in another. It's often used in case-control studies.
OR = (odds of event in exposed group) / (odds of event in non-exposed group)
3/ OR Interpretation:
• OR = 1: No difference in odds between groups
• OR > 1: Greater odds of the event in the exposed group
• OR < 1: Lower odds of the event in the exposed group
4/ Hazard Ratio (HR):
HR is a measure of how often a particular event happens in one group compared to another, over time. It’s commonly used in survival analysis.
HR = (hazard rate in exposed group) / (hazard rate in non-exposed group)
5/ HR Interpretation:
• HR = 1: No difference in hazard between groups
• HR > 1: Higher hazard of the event in the exposed group
• HR < 1: Lower hazard of the event in the non-exposed group
6/ Key Considerations:
• Confidence Intervals (CI): Always report CIs along with ORs and HRs. A CI that includes 1 suggests that the result might not be statistically significant.
7/ Adjusted vs. Unadjusted:
• Adjusted ratios consider confounders, whereas unadjusted don't. Always clarify which type you're reporting, and consider potential confounders in your study.
8/ Causation vs. Association:
• OR and HR only measure association, NOT causation. Other evidence is needed to infer causality.
9/ Clinical vs. Statistical Significance:
• A statistically significant OR or HR might not be clinically meaningful. Consider the effect size, and the clinical context.
10/ External Validity:
• An OR or HR from one population may not apply to another. Always consider the study's population, and be cautious when generalizing results.
11/ Limitations:
• Like all statistical measures, ORs and HRs have limitations. Be transparent about potential biases, confounders, and other limitations in your study.
12/ Conclusion:
Interpreting and reporting ORs and HRs correctly is crucial for clear communication in research. Always consider the context, report confidence intervals, and remember the difference between association and causation.
(Note: This is a basic overview and there are more detailed nuances and considerations when interpreting ORs and HRs in different contexts.)
#Epidemiology #Statistics #DataScience
All #HealthyR#rstats advent calendar posts of R tips now at https://t.co/boLJNDibeJ
Most popular:
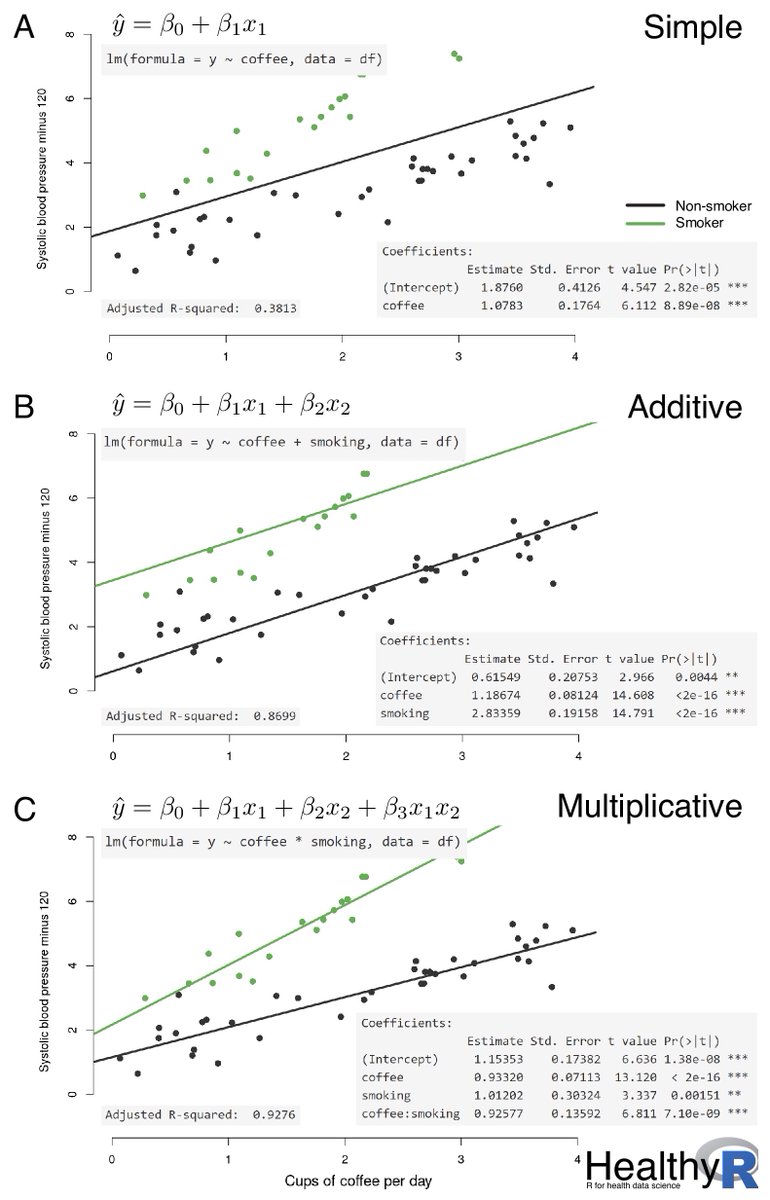
💡Understanding linear/logistic regression
📈Univariable vs multivariable
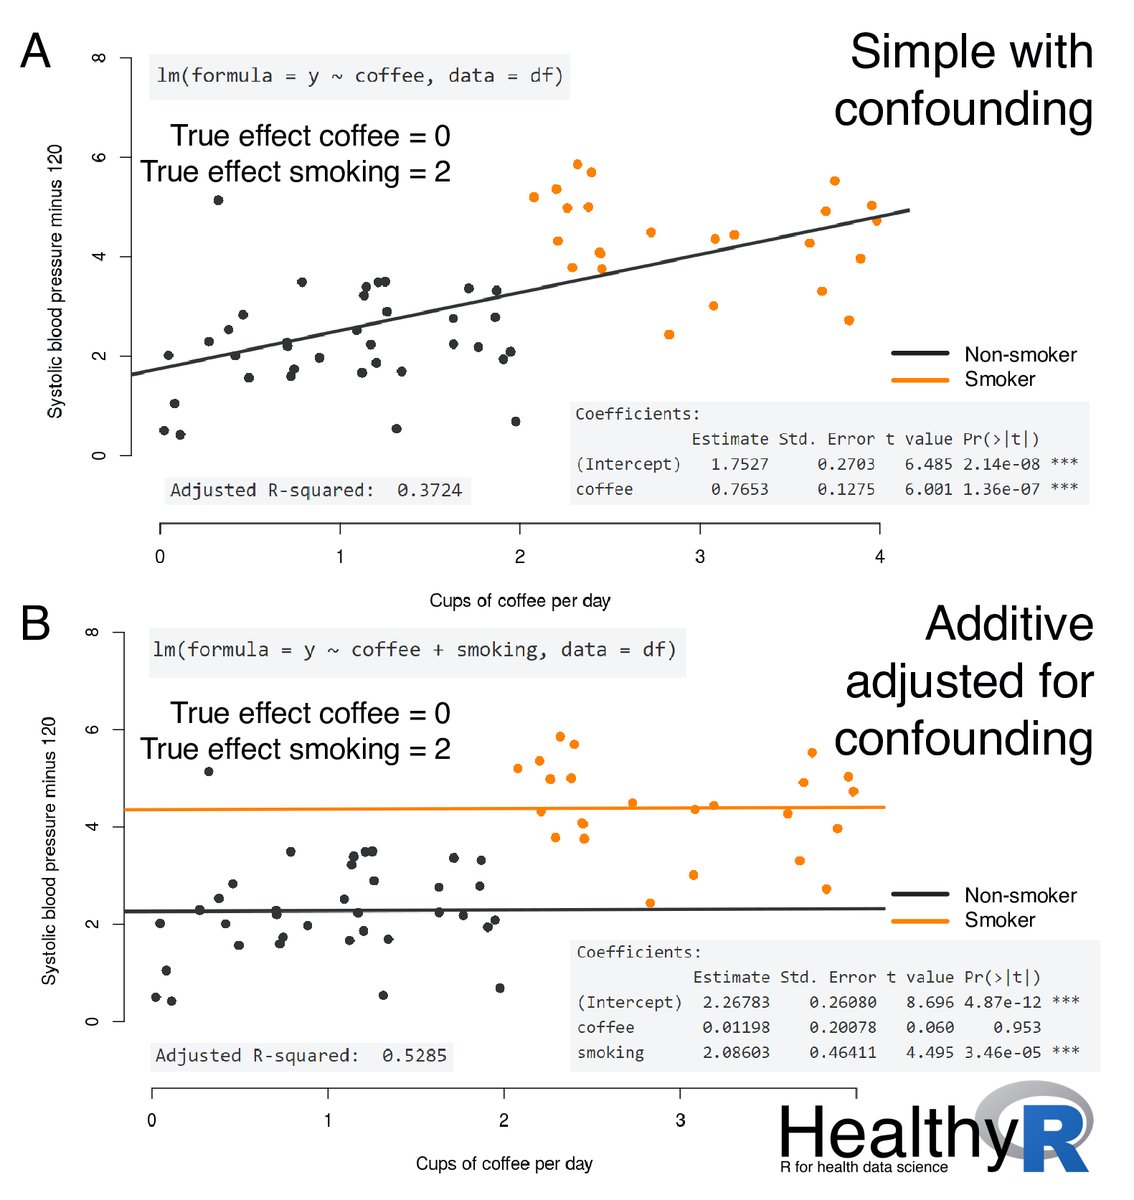
⚰️Confounding
JKL20 for 20% off, free worldwide shipping: https://t.co/L42EZJPI88
That's a clear and clever general public message about health economics! We must insist on this kind of discussion in Italy as well
https://t.co/UPH90C72oY
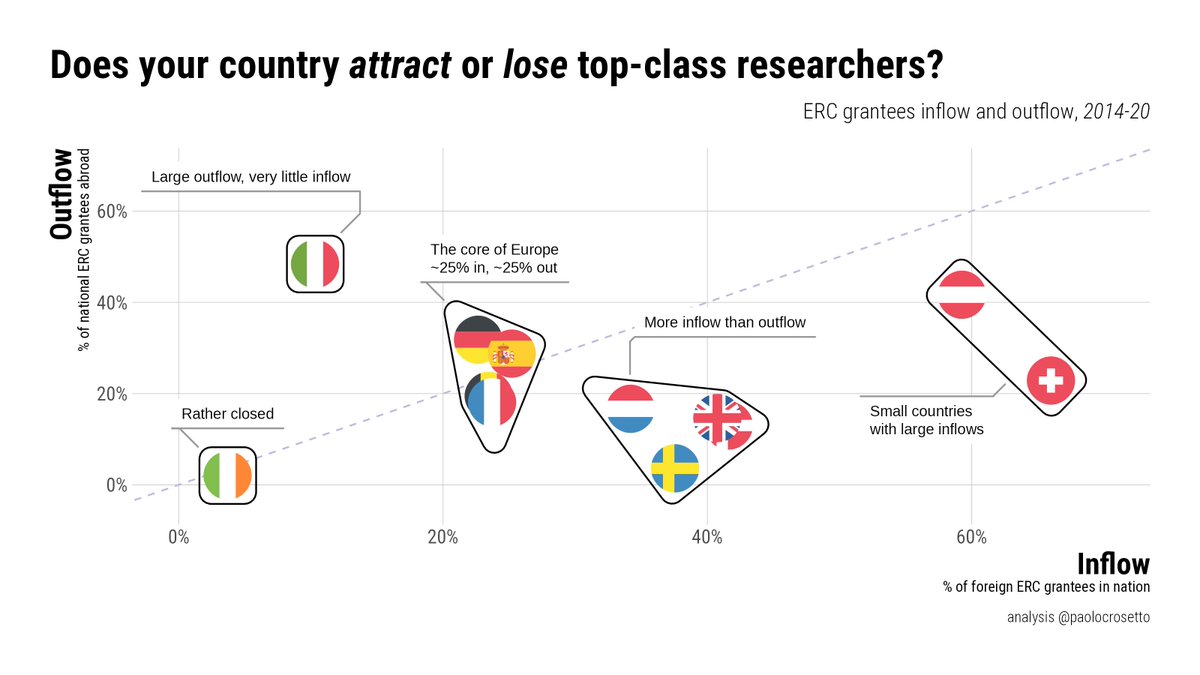
Does your (EU) country attract or lose top researchers?
AT, CH attract a lot.
FR, DE, BE, ES are open places: as many leave as arrive.
IE is a closed system.
Italy, there is something very wrong: *very* few come, many go.
Plot made with @ERC_Research data.