@LexiThompsonPV $LULU didn't just sell off.
It blew through PP, S1, S2, AND S3 in a single session.
Current Zone: Below S3 · $102.55 NOW trading: $100.55
When there's no floor, the market builds a basement.
Full pivot analysis at https://t.co/BwgcXR2BhS #LULU#TechnicalAnalysis $LULU
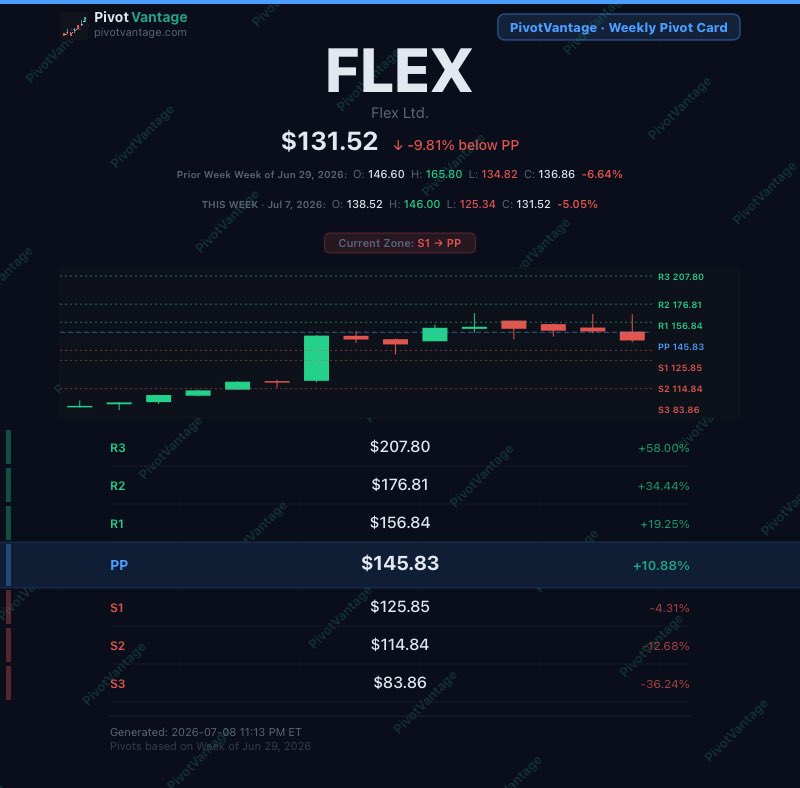
$FLEX weekly context 👇
Weekly PP: $145.83
Current: $131.52 (-9.81% below PP)
3 days left in the week.
Weekly S1 $125.85 held today.
That's your line in the sand.
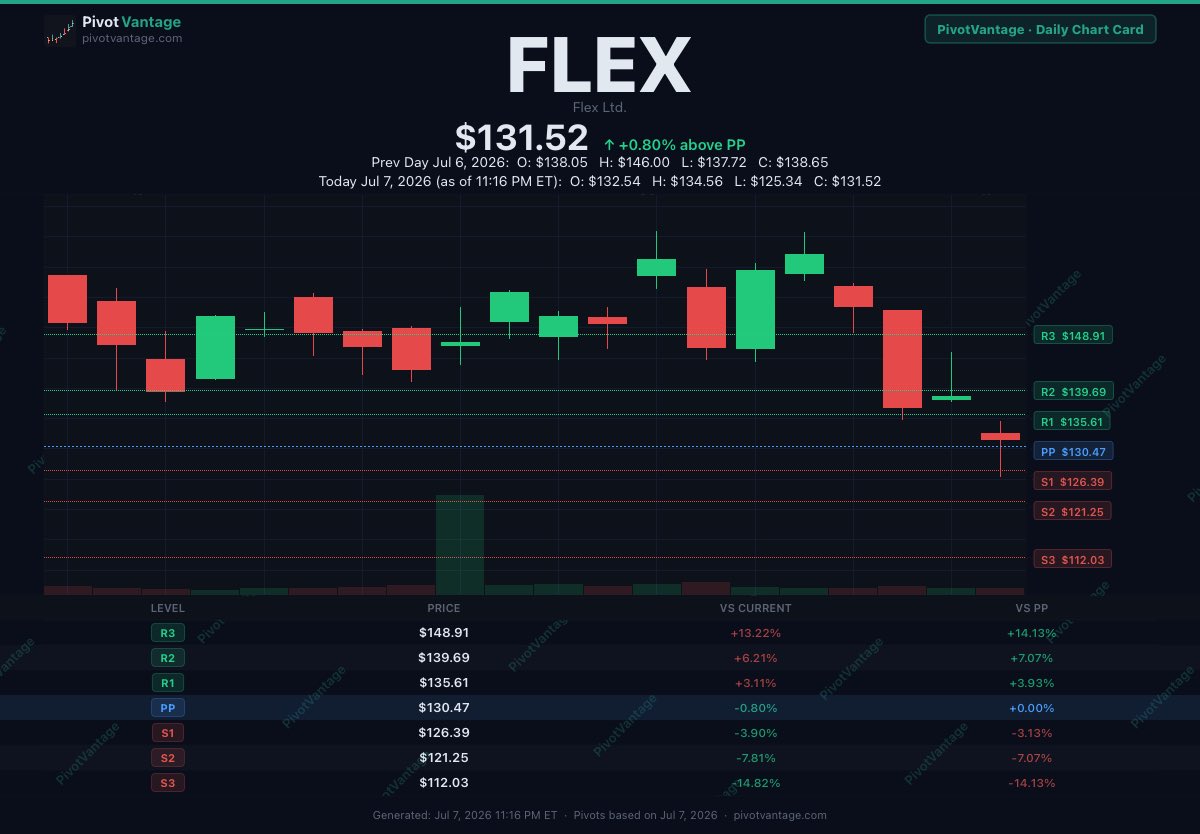
$FLEX daily PP holding by a thread.
PP: $130.47 — closed +0.80% above
Today's low $125.34 tapped Weekly S1
at $125.85 and bounced.
Weekly already -9.81% below PP.
Not even Wednesday.
Key tomorrow: hold $130.47 or S1 at $126.39
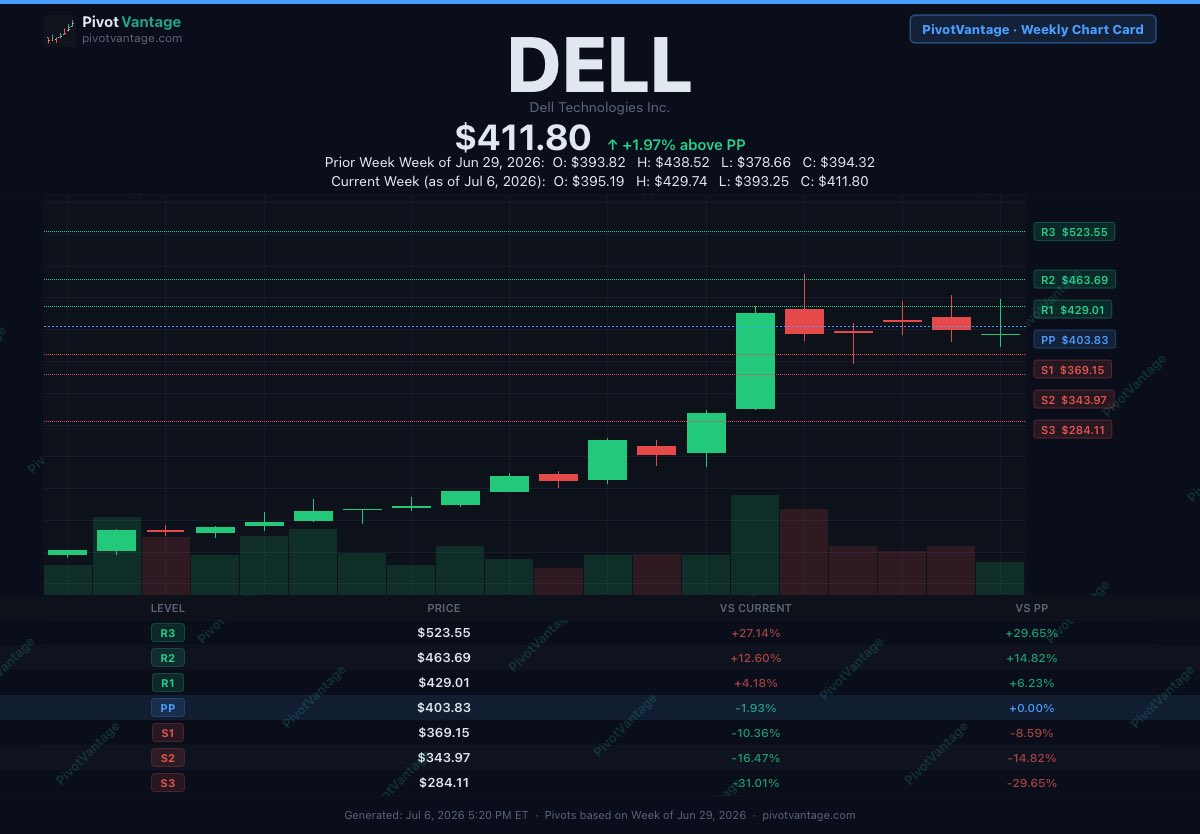
$DELL closed at $411.80. Trump mentioned it from the NYSE floor — stock surged 7.7%. Weekly pivot reclaimed at $403.83 ✅ Monthly PP at $419.33 is the real test. Above it = R1 at $429 in play. Below = noise. Levels don't lie. 📊 https://t.co/bUublUiULE
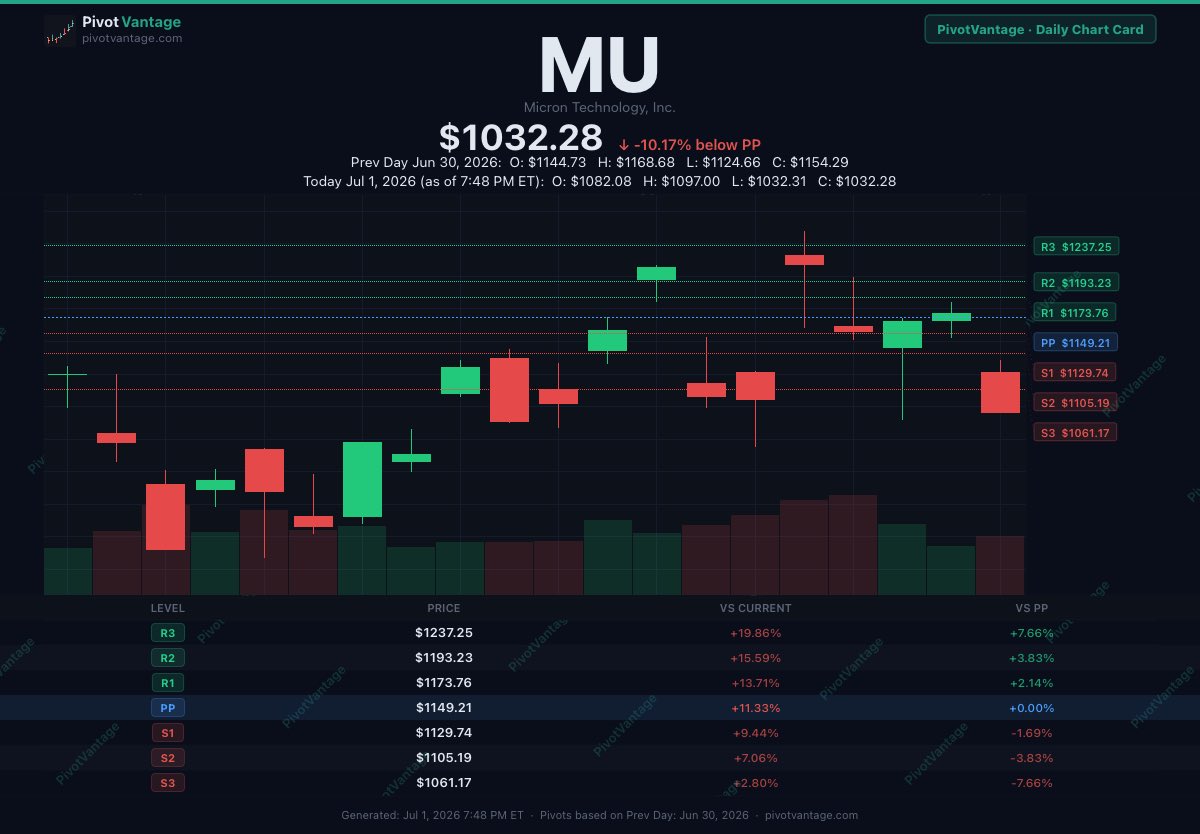
@Mr_Derivatives “No reaction" is generous — $MU is down hard on every short-term level today:
Daily -10% below PP, Weekly -8%, Monthly -5%.
Quarterly & Yearly still deeply positive though. Short-term rough patch inside a massive longer trend.
PivotVantage 👇
@burrytracker $PLTR up on the Burry news — first trading day of the new month AND new quarter.
Weekly: pinned exactly at R1 ($125.74) Monthly: still -2.5% below PP after a brutal -27% June
Fresh levels, fresh quarter. Recovering fast, but the bigger level isn't reclaimed yet.
PivotVantage 👇
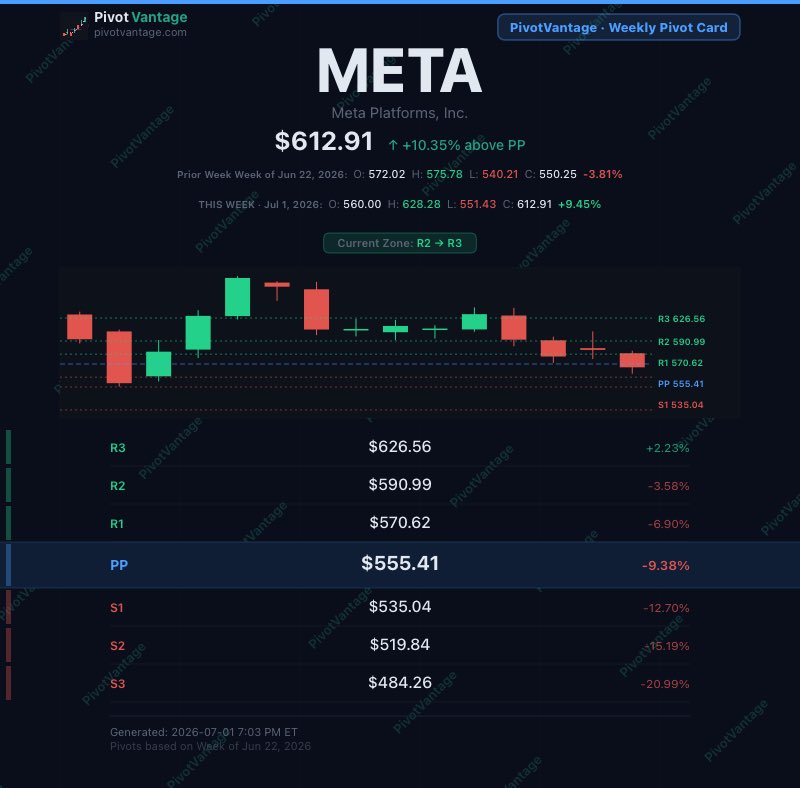
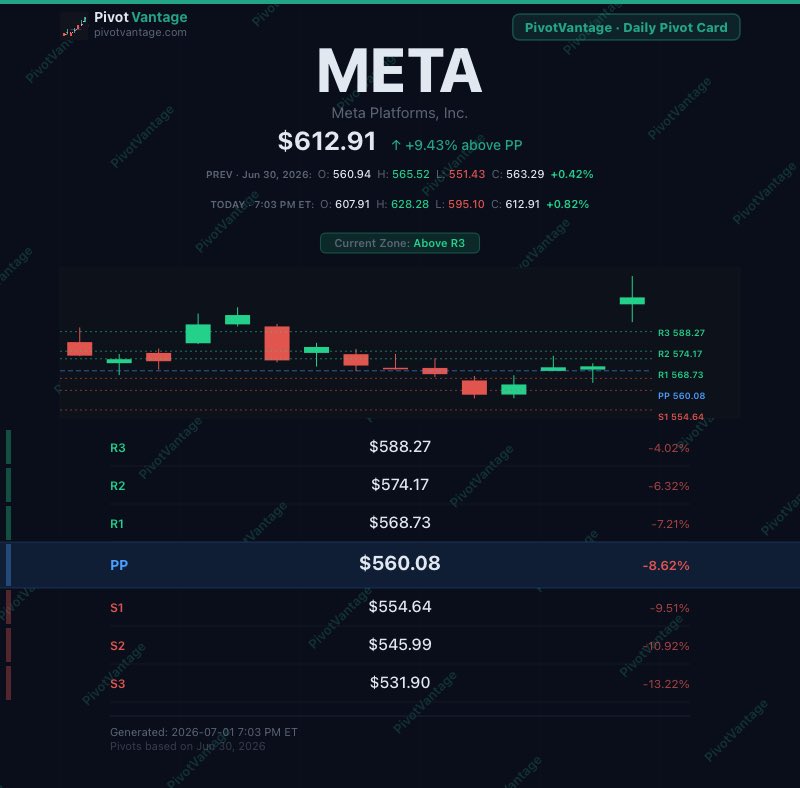
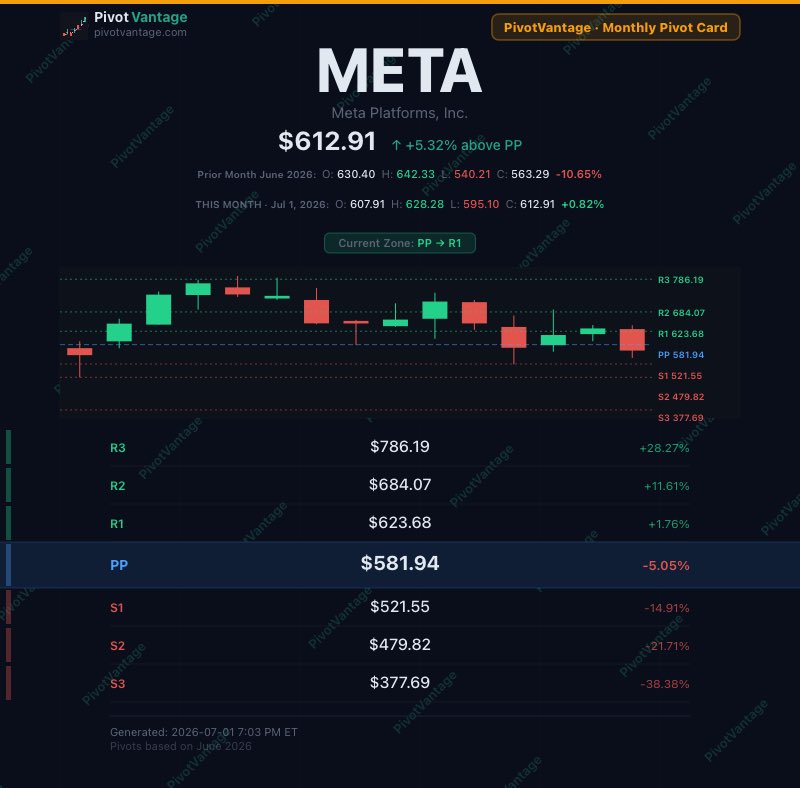
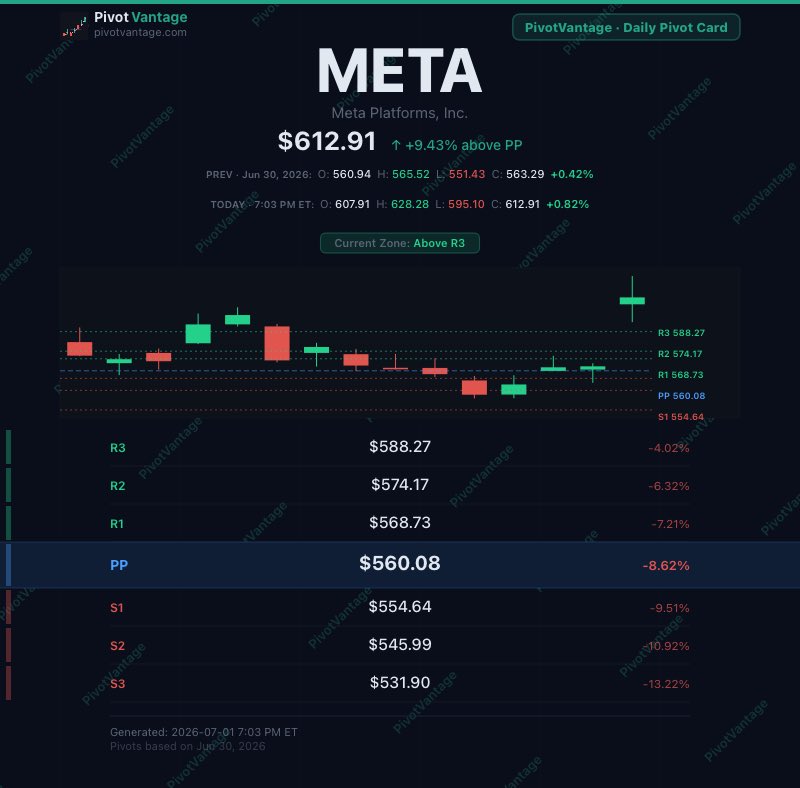
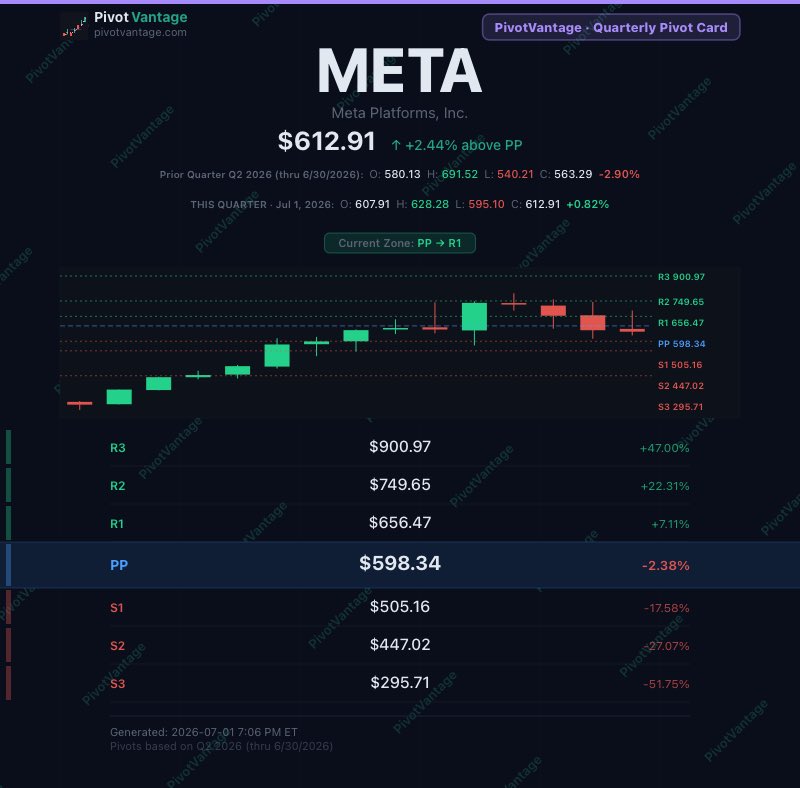
META closed above daily R3 — fully extended on the tape everyone's watching.
But the ladder tells a different story the higher you go:
Weekly: R2 → R3 (2% from ceiling)
Monthly: PP → R1 (1.8% from R1)
Quarterly: just cleared PP, 7% from R1
The daily already spent its move. The trend hasn't.
PivotVantage 👇
Every stock has pivot levels that actually hold. Most people are trading blind to them.
PivotVantage mapped $ELF's entire June range in advance — S1 to R2, pennies from the actual print.
New month, new levels, already live for July.
Free right now. https://t.co/bUublUiULE
Called it before June happened: S1 $49.15 → actual low $49.22 (99.9% accurate). R2 $70.85 → actual high $70.30 (99.2% accurate). Bullseye on the full range.
Now $ELF is breaking through it. PivotVantage 👇
$ELF Monthly Pivot S1: $49.15
Actual June low: $49.22 ✅
Monthly R2: $70.85
Actual June high: $70.30 ✅
Full S1 to R2 monthly range. Mapped. In. Advance.
That is pivot math. That is @PivotVantage.
https://t.co/bUublUiULE
ELF UPDATE 🧵
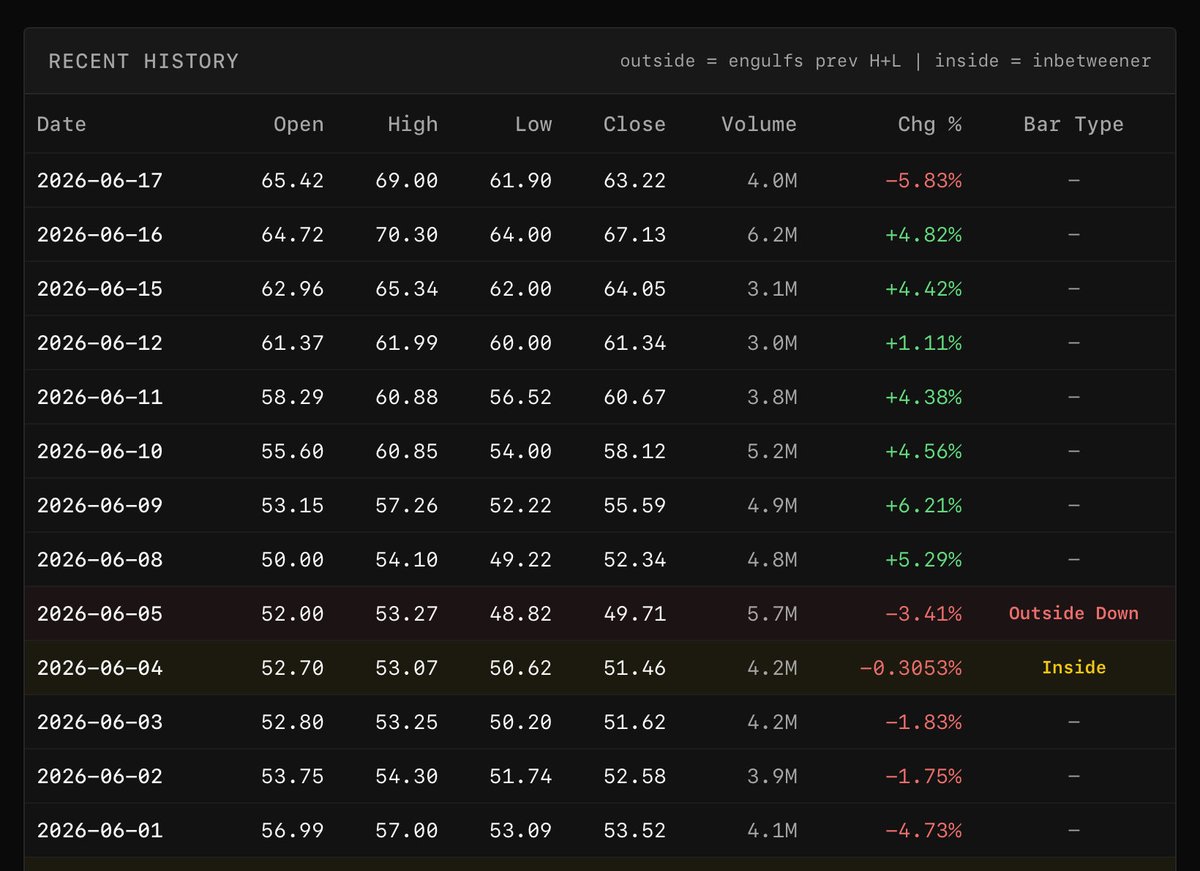
7 consecutive up days. Then a -6.74% sledgehammer. Then today…
Inbetweener.
Stayed inside yesterday's range. Didn't break down. +4.10%.
The math is sending a message:
📊 Daily: Inbetweener — indecision 📈 Weekly: 1 Up 📉 Monthly: 1 Down 📉 Quarterly: 2 Down
"Next breakout move is the real move."
Bulls couldn't get above $65.41. Bears couldn't get below $61.90.
One of those levels breaks first. That's the tell.
Following this live.
https://t.co/EzmE5o9339
META closed above daily R3 — fully extended on the tape everyone's watching.
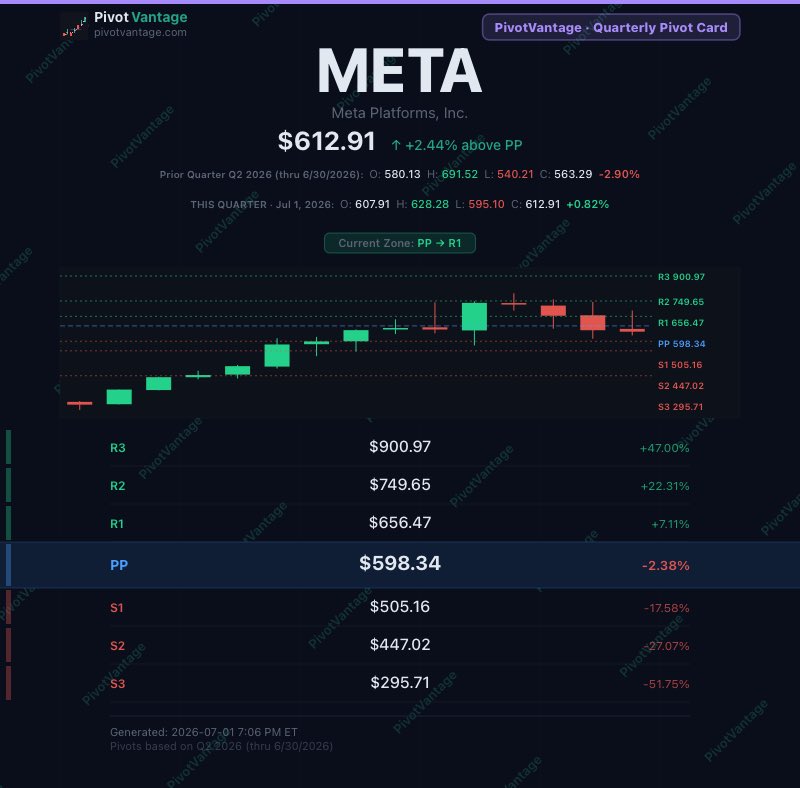
But the ladder tells a different story the higher you go: Weekly: R2 → R3 (2% from ceiling) Monthly: PP → R1 (1.8% from R1) Quarterly: just cleared PP, 7% from R1
The daily already spent its move. The trend hasn't.
PivotVantage 👇
@StockMKTNewz META closed the day above daily R3, up big — looks maximally extended.
Zoom out and the story changes:
Weekly: R2 → R3
Monthly: PP → R1 (still $10 below R1)
Quarterly: barely above PP
The daily is stretched. The trend isn't even close to it yet.
PivotVantage 👇
@RedDogT3 Confirming on the quant side — HIMS ran straight into monthly R1 ($38.64) on day one of July. High of day $38.50, 14 cents short, closed $37.57. Clean level test.
PivotVantage 👇
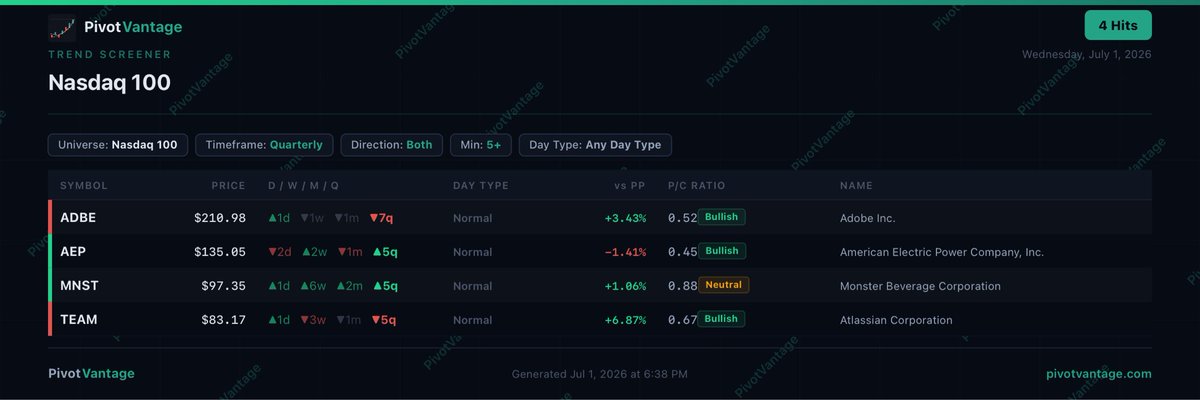
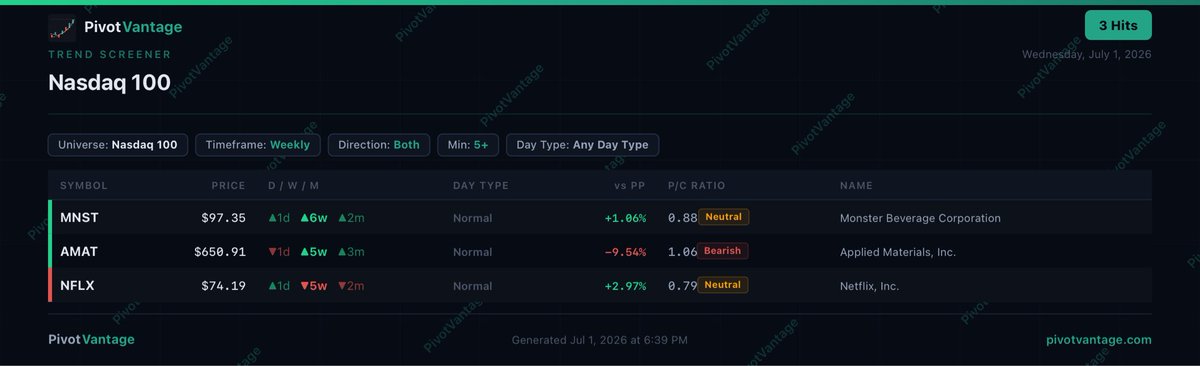
@RedDogT3 Nice half-year wrap. Zoomed into current trend state on the same Nasdaq 100 universe — MNST bullish 6 weeks straight AND 5 quarters straight. Same name confirming on two different timeframes.
D/W/M/Q trend screener, PivotVantage 👇
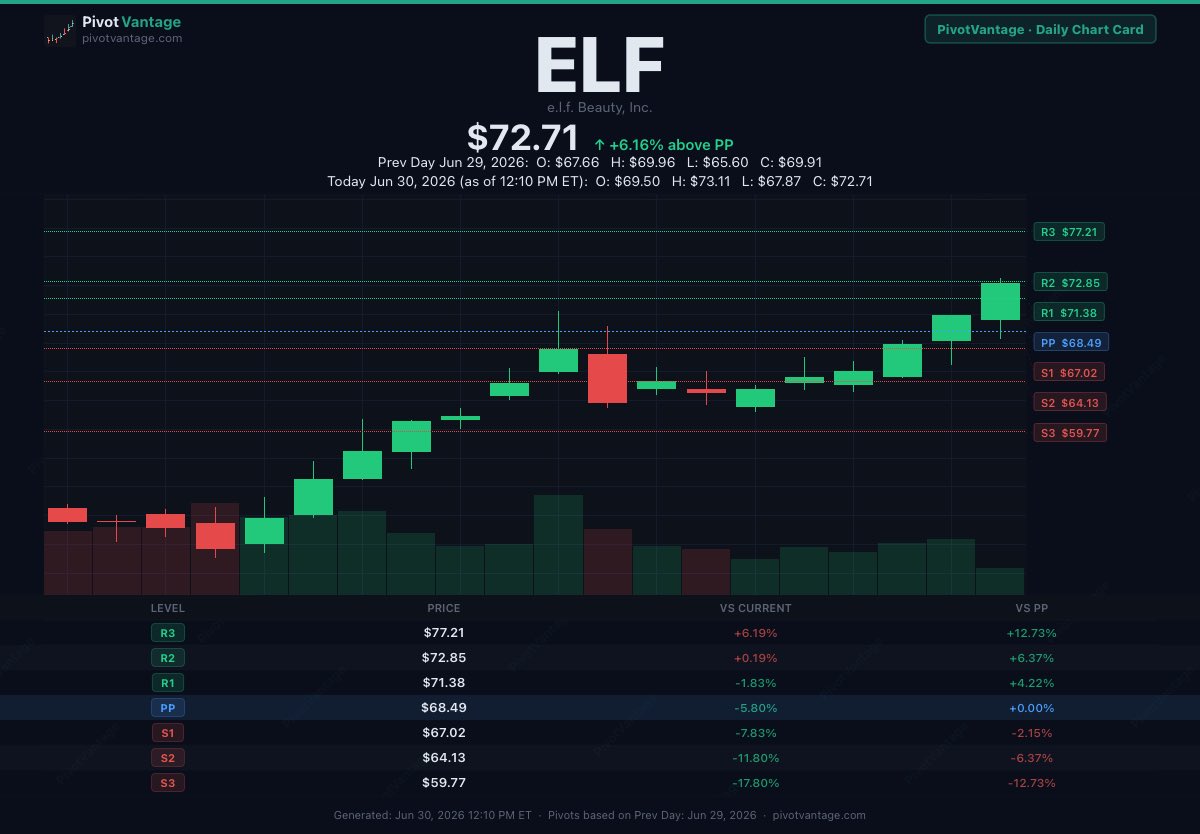
$ELF ripping today, now $72.71 (+4.0% on the day, +6.16% above PP) — pushing right into R2 ($72.85).
15-day candle run says it all. R1 reclaimed, R2 next, R3 ($77.21) the next target if this keeps going.
This name has been an absolute printer. #PivotVantage
At-the-money read: $730c 7/17, delta .548 (right at 50/50), last $57.71.
IV Rank still 75.4, contract IV 87.6% — even the ATM strike is pricing in a big move. Confirms the thesis: premium is rich across the chain, not just OTM. #PivotVantage
$AMAT $733.60, +5.6% today.
IV Rank 75.4 (current IV 87%) — elevated. Max pain $500, P/C ratio 0.75 (neutral).
With IV this hot, premium is rich on both sides — setup favors selling, not buying. Short strangle or covered calls look better here than chasing calls. #PivotVantage