China’s central bank extended its gold-buying streak in May, adding to holdings as prices of the precious metal remained under pressure https://t.co/szMR1a5Kxa
The assets the entire world buys to protect against war and inflation just did the exact opposite of what they were supposed to do.
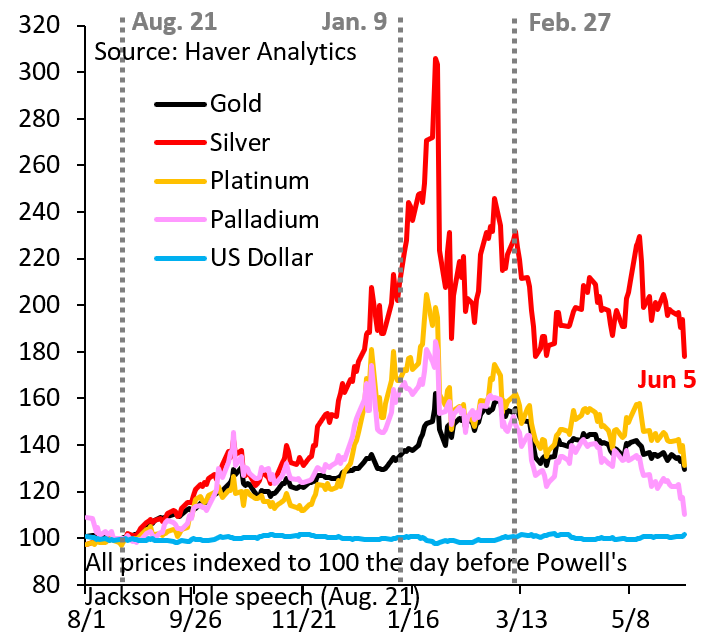
Gold hit an all-time high of $5,600 on January 29, up 31% in just 29 days, adding $9 trillion to its market cap.
Silver hit $121 the same month, up 68% in 29 days, adding $3.5 trillion to its market cap.
Every safe haven buyer was positioned perfectly.
Then the US-Iran war escalated in February, the Strait of Hormuz closed, oil hit $93, and inflation climbed to 3.8%. These are exactly the conditions gold and silver are supposed to thrive in.
Instead, gold has now crashed 23% from its peak, wiping out $8 trillion in market value.
Silver crashed 44%, wiping out $3.5 trillion. Both are now negative for 2026.
The Fed uncertainty made it worse.
Kevin Warsh takes his first policy meeting on June 16 with no clear direction, historically the exact environment where gold surges. It is still falling.
$11.5 trillion wiped out from the two assets the entire world holds specifically for moments like this.
#Gold's breakdown below key support has increased downside risks in the near term. With #inflation holding firm and yields moving higher, the path of least resistance remains lower until a stronger support zone attracts fresh demand.
@FXEmpirecom
https://t.co/qsVavBRa4U
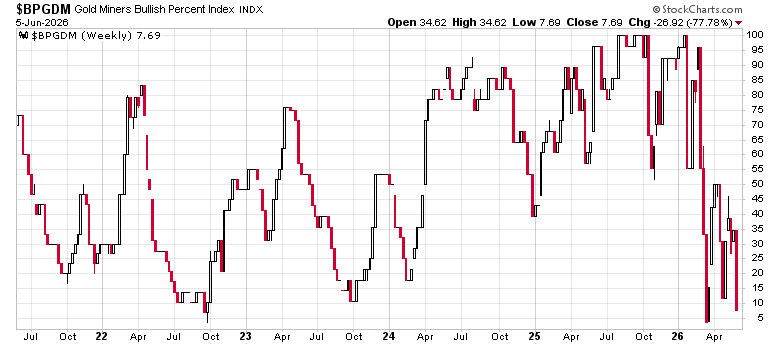
The Gold Miners Bullish Percent Index $BPGDM also shows total capitulation, having dropped a historic 78% (!) last week. 👇
It was one of the worst weeks in many years for gold and silver mining equities.
$GDX $GDXJ
Precious metals crashed hard yesterday. Key question is whether last year's rise was a one-off - a bubble like so many before - or something more lasting. I'm a believer in the debasement trade, but the conditions for it to restart don't exist currently...
https://t.co/vdpzPH8TBi
🚨The US stock market is more overvalued today than at any point in the last 125 years:
Tobin's Q Ratio hit 2.11, the highest reading since records began in 1900 and +149% above its long-term average of 0.85, according to Advisor Perspectives analysis.
The Q Ratio measures the total market value of all US corporations relative to the replacement cost of their physical assets.
A ratio above 1.0 suggests the market is pricing companies above what it would cost to rebuild them from scratch.
At 2.11, investors are paying more than twice what these companies would cost to replace, the highest level on record.
However, this is not a short-term timing indicator, and high readings can persist for extended periods, particularly where intangible assets, software, brand value, and earnings power are poorly captured by replacement cost measures.
Historically, extreme Q Ratio readings have tended to align with late-stage bull market conditions, including prior major peaks, but the signal is more structural than tactical.
The market is not just expensive, it is priced for perfection.
#Gold hit the upper boundary of its long-term ascending channel and started correction.
$3500-$4000 zone remains the accumulation zone for gold investors.
Since 2000:
Silver: 15.3x
S&P 500 total return: 8.2x
Silver pays no dividend.
No buybacks.
No cash flow.
And yet it still outperformed the most followed stock index in the world.
Hard assets have done better than most people think.
The Gold Miners Bullish Percent Index just hit 7.69.
March was the only other time we saw a reading this washed out, and that marked a major sentiment reset in the miners.
In simple English, most people have given up again.
This is exactly what full capitulation feels like. Weak hands get forced out, sentiment gets cleansed, and the sector starts setting up for the next turn higher.
These are never comfortable spots in real time, but historically this is the kind of panic zone where the best opportunities begin to form.
The US government considering revaluing gold is an indictment of the dollar and treasury system.
The very fact they are discussing this publicly means they know the end of the existing system is near.
That doesn't give people a ton of time to prepare.
Silver Price Targets 2026 – Updated Bank Forecasts!
Silver spot is hovering around $73/oz right now, but the big banks are turning extremely bullish:
• HSBC → $75 avg
• UBS → $80 (Dec)
• J.P. Morgan → $81 avg
• Goldman Sachs → $85–100
• Citigroup → $110
• Bank of America → $135–309 #silver
Inflation in Europe is rising rapidly:
Eurozone Manufacturing PMI Input Prices spiked to 80 points in May, the highest since May 2022.
This also marks the largest monthly increase in costs for firms over the last 4 years.
Furthermore, PMI Output Prices surged to 62 points, the highest in 3.5 years.
The rate companies are increasing the prices they charge for goods they produce has surged +12 points, or +24%, since the start of 2026.
This surge has been primarily driven by rising energy and raw material costs.
Meanwhile, supply chain delays are up to the highest level since the pandemic supply squeeze of 2022, adding further pressure on prices.
As a result, factories are forced to pass higher costs on to customers, which will push inflation even higher over the next few months.
Price pressures across Europe are accelerating.