FY21- Lockdown killing economic activity (-6%)
While economies worldwide have been hit hard, India has suffered one of the largest contractions. The fact that India’s growth rate in 2019 was among the highest makes the drop due to Covid-19 even more noticeable.
@Mukul_SkuD Yup!! bar graph should be used
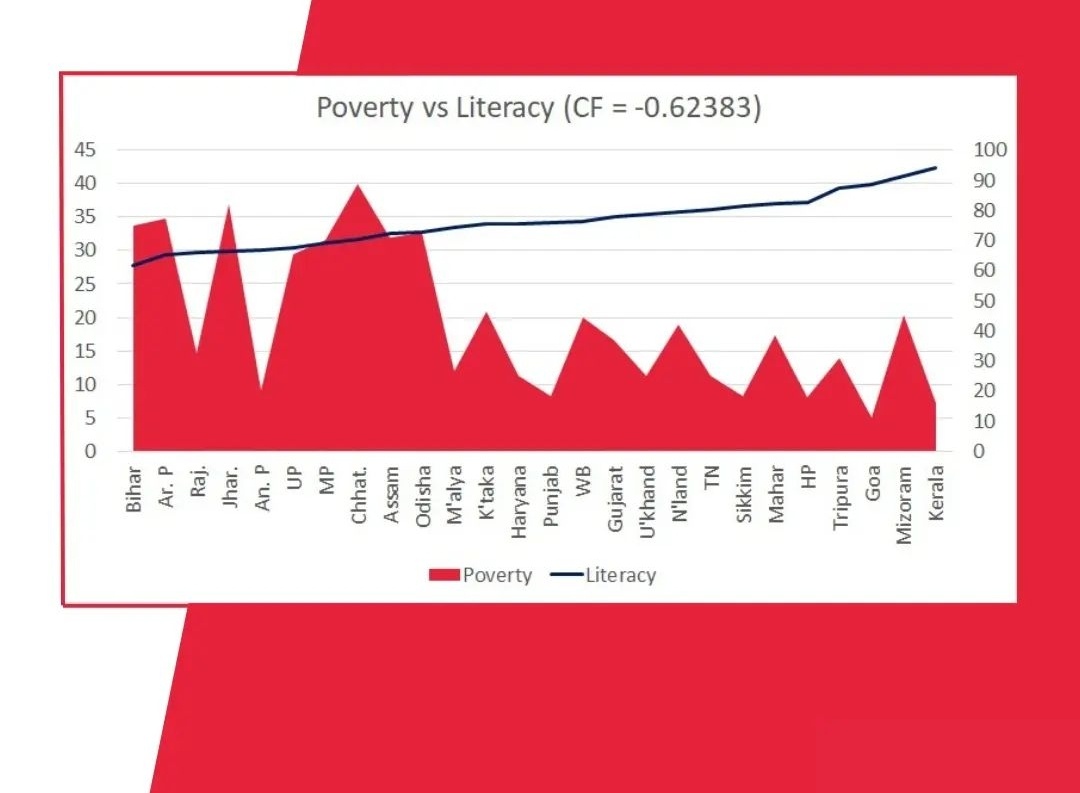
Area chart is for time series data, can't be used for different states data
Also line chart has no significance here
What's wrong with these graphs?😬😬😬
Not talking about your opinion on the data shown, I am just asking is there any structural issue with these graphs😬
(Saw these graphs on an insta page)
@AryamanBharat Actually bar graph should be used
Area chart is for time series data, can't be used for different states data
Also line chart has no significance here
@abhimanyu_uwach@WokePandemic There was a time when women education was restricted and that's the truth.
If there is some improvement in these things then no one should behave like shaadi me aaye hue naraaz phupha here
Usko problem hai isiliye he tweeted that thing.
Ab i don't have time to argue...bye
@abhimanyu_uwach@WokePandemic But this literacy is also important. Read it's defination
The attribute you are talking about can't be even calculated, then what index we can use?
There is a reason why these indexes are used