Bitcoin "crashed" to $107K and it's still up 55% over 12 months.
That's double the Nasdaq and 4x the S&P 500, which are priced in a currency having its worst year in decades.
Guess which one the media considers "risky."
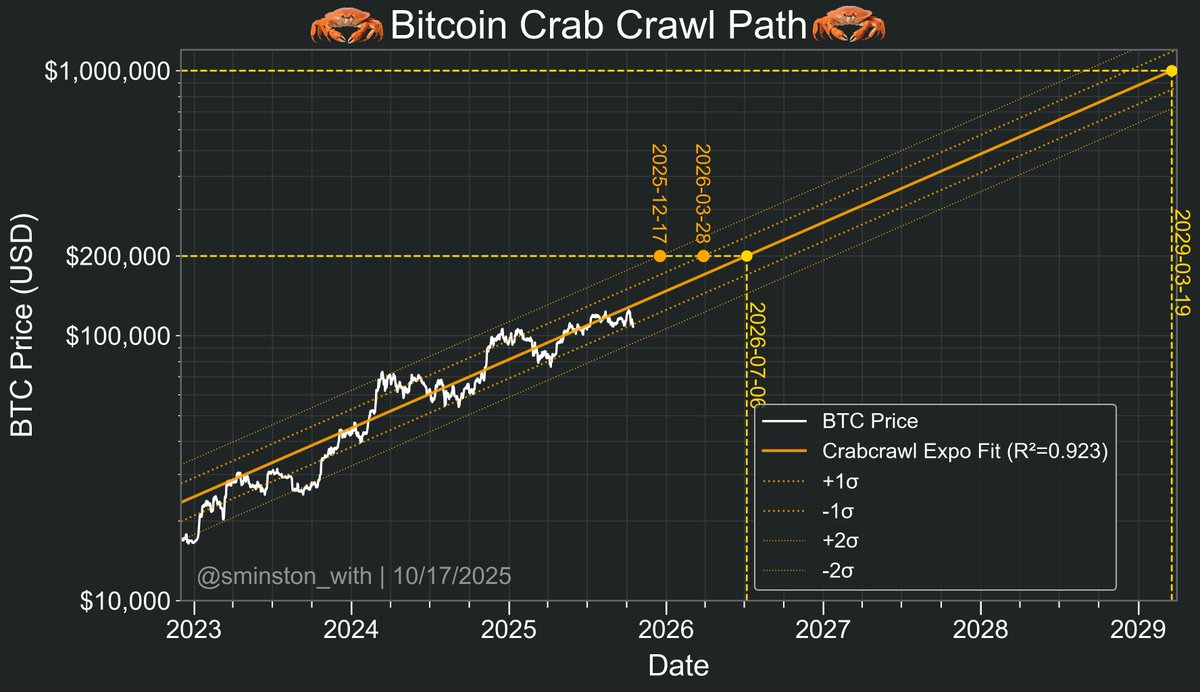
🦀Let's check in on this Crab Crawl market🦀
Is it really that bad?
Wow, big dip down to $105-106k... no doubt invokes bad feelings.
BUT let's inject some perspective: this dip just brought us down to the -1 standard deviation based on data since late 2022 ('the last cycle bottom'). Look how many times we've visited this line before!
Take heart - keep marching (or crawling 🦀).
And keep HODLing!
These two bitcoin animations received 2.3M impressions in the last 72 hours!
A common saying is that school teaches us math, like cosines and the hypotenuse of a triangle, but we never use it at work. As an engineer I have to use math everyday to calculate satellite orbits and to predict signal strengths over great distances.
I enjoy using my skills to visualize the mathematics of bitcoin so that everyone--the lawyers and the dishwashers--can understand the models that help me sleep easy when the prices goes down.
Seeing these videos succeed on X gives me a lot of joy. If they were helpful to you, consider hitting that repost button. It really helps us smaller accounts.
I'll drop a few of my other charts in the comments for the people who don't know me.