Trade Like A Casino, Not A Gambler
Anyone who has driven down the strip in Las Vegas can tell who is rolling in the money – the Casinos! Why do gamblers keep going back, despite losing the majority of the time? A combination of misplaced hope, fantasies about the Big Win, promising themselves they will be able to walk away at will, and probably the inability to calculate probabilities.
These symptoms are often shared by new traders who have lost money in the stock market, when visions of effortlessly trading their way to prosperity clouded their judgement.
In gambling there are only two sides; you are a either gambler, or you are the house. The gamblers have the long term odds stacked against them. The casino has stacked the odds against the gambler, and the more they risk, the greater the chance that they will leave empty-handed.
The book featured in this blog post explains the winning principles of trading by using the casino paradigm. Profitable traders operate like casinos, with the odds in their favor over the long term. They have learned to trade with historically, back-tested trading systems that put the odds on their side. Much like casino operators, they risk small amounts of equity per trade (around 1% – 2% of their accounts), so no one trade can hurt them.
Most unseasoned traders behave like gamblers. They bet on stocks so haphazardly that they have a 50-50 shot like a roulette wheel – red or black. Many times, these traders hurt themselves by buying into the market in a downtrend and shorting into a rally, believing that they can pick the bottom or top. Some new traders would love to have a 50/50 win ratio, because most don’t get that lucky.
New traders often have no concept of risk management, and like gamblers, they eventually give back all their winnings to the house. Richard Weissman’s book is about becoming the casino by using math and probabilities instead of emotions. By being psychologically disciplined and refusing to become invested in outcomes, traders will overcome emotional barriers to trading success.
Casinos set table limits so a gambler cannot hurt their bottom line on any one bet. By understanding the importance of risk management and a positive expectancy model, traders will control their own odds.
Traders must have the discipline to stick with positive expectancy models. Casinos don’t panic and change their rules when a gambler goes on a winning streak, because they know luck eventually runs out.
Traders should never go off their trading plan to try and win back money that they lost. Luck is what gamblers hope for, while good traders are trading for a positive expectancy. Successful traders and casino operators consistently play the probabilities and manage risk in order to win.
Traders should trade the market – not the money involved in their account. Each trade must be based on a proven trading system of entries and exits, and not by how much money a trader hopes to make. Traders should follow the flow and let the market come to them, never letting failed trades from their past force them to revenge trade.
Winning traders always stick with their historically proven trading system.
Casinos do not close down if gamblers go on a winning streak, because they have calculated the odds and play based on those odds. Trading Like a Casino is a great book with a great analogy to explain how to win at the trading game. The principles the book explains are spot on, and are easy to understand.
If we can’t beat them, let’s join them. Be the casino, not the gambler.
Moving Average Answer Key:
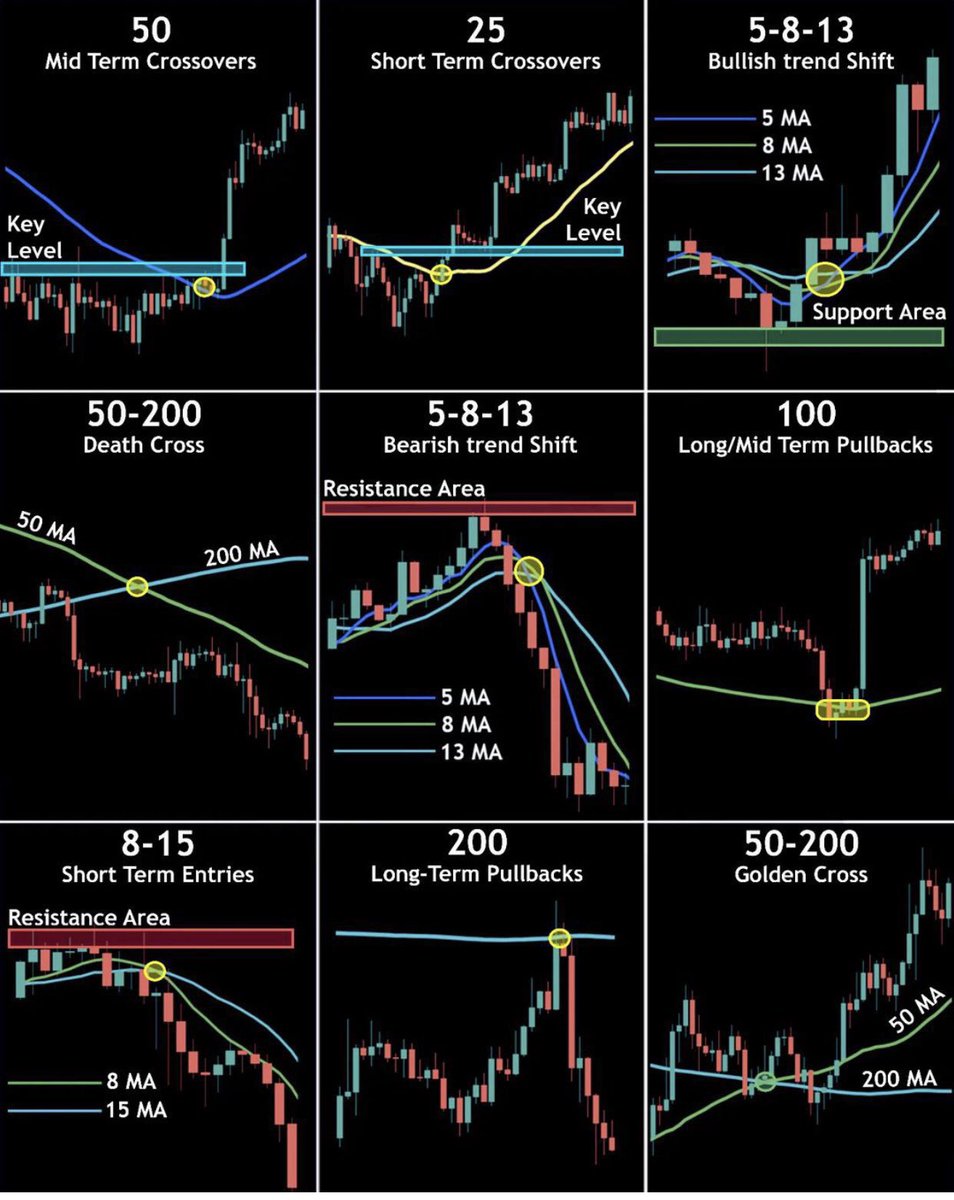
Moving averages allow traders the ability to quantify trends and act as signals for entries, exits, and trailing stops. They can become support and resistance, and give the trader levels to trade around. Below are examples of the specific moving averages with time frames.
• 5 Day EMA: Measures the short term time frame. This is support in the strongest up trends. This line can only be used in low volatility trends.
• 10 day EMA: “The 10 day exponential moving average (EMA) is my favorite indicator to determine the major trend. I call this ‘red light, green light’ because it is imperative in trading to remain on the correct side of a moving average to give yourself the best probability of success. When you are trading above the 10 day, you have the green light, and you should be thinking buy. Conversely, trading below the average is a red light. The market is in a negative mode, and you should be thinking sell.” – Marty Schwartz
• 20 day EMA: This is the intermediate term moving average. It is generally the last line of support in a volatile up trend.
• 50 day SMA: This is the line that strong leading stocks typically pull back to. This is usually the support level for strong up trends. Use 50-Day Average For Trading Signals
• 100 day SMA: This is the line that provides the support between the 50 day and the 200 day. If it does not hold as support, the 200 day generally is the next stop.
• 200 day SMA: “My metric for everything I look at is the 200-day moving average of closing prices. I've seen too many things go to zero, stocks and commodities. The whole trick in investing is: “How do I keep from losing everything?” If you use the 200-day moving average rule, then you get out. You play defense, and you get out.” - Paul Tudor Jones
Bulls like to buy dips when price is above the 200-day moving average, while bears sell rallies short below it. Bears usually win and sell into rallies below this line as the 200 day becomes resistance, and bulls buy into deep pullbacks to the 200 day when the price is above it. This line is one of the biggest signals in the market telling you which side to be on. Bull above, Bear below. Bad things happen to stocks and markets when this line is lost.
Don't memorize patterns, candlesticks, etc.
If you want to get better at this game, ask yourself:
What are traders on the sideline thinking?
Where will other traders get trapped?
Where’s the path of least resistance?
Where will new players enter?
Where will losers cut loss?
Stop loss and position size go hand in hand.
When you increase the size of your stop loss, reduce your position size.
When you decrease the size of your stop loss, you can increase your position size.
Understand their relationship and you'll never blow another account.
My favorite trading books:
1. Market Wizards
2. Trend Following
3. How to Make Money in Stocks
4. Trade Like a Casino
5. Trade Your Way to Financial Independence
6. Trading for a Living
7. Reminiscences of a Stock Operator
What would you add?
Curated tweets on How to Sell Straddles
Everything covered in this thread.
1. Management
2. How to initiate
3. When to exit straddles
4. Examples
5. Videos on Straddles
Share if you find this knowledgeable for the benefit of others.
@AdlingeSandip@TraderMindset Sandip, I think better if you spend time with charts you will get an idea. It varies depends on risk and your trading style. I respect Shruthi Ma’m, even you can try same time frames with limited risk. If it works you can adapt them. Good luck 🤞
@somshubhra54@TraderMindset Instead, try to follow everyday with VWAP and EMA crossovers and S&T. Practically you will learn how does it work n what do you need to do. I hope you do. #priceaction