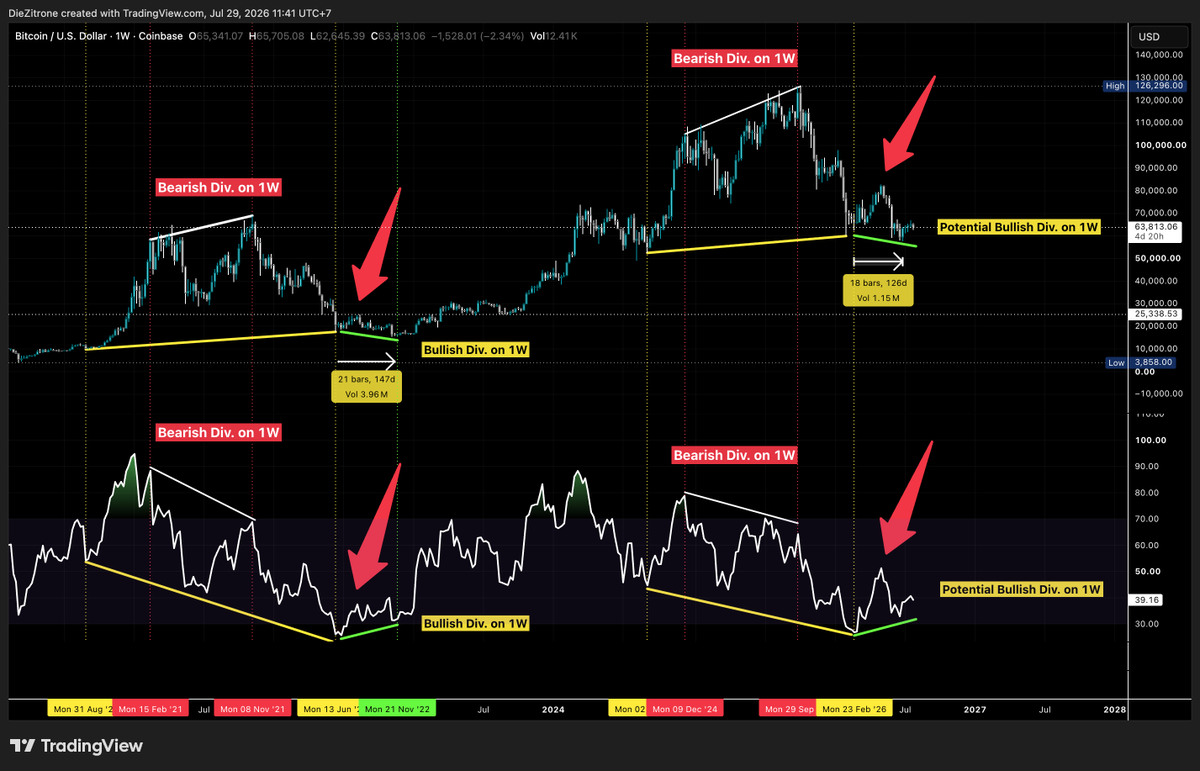
$BTC
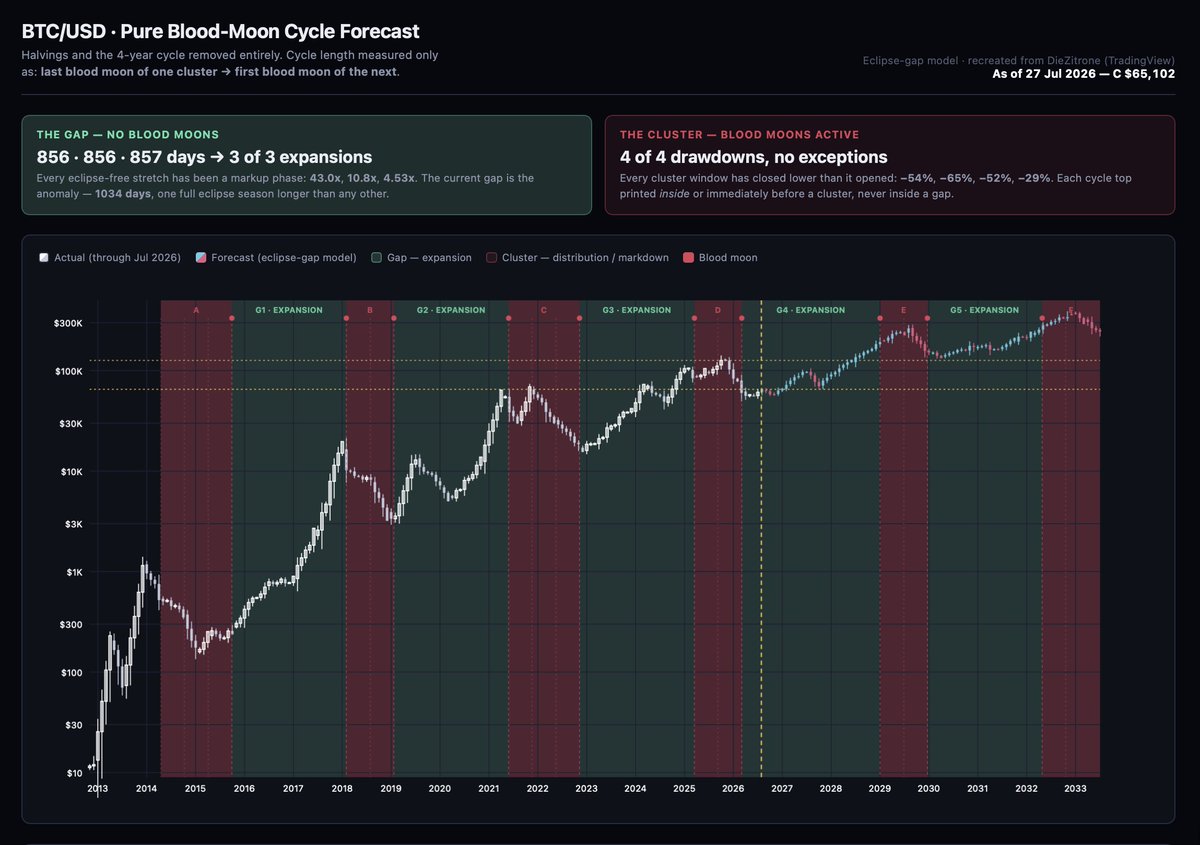
I have been working with Claude for a week now to analyze the Blood Moon 🌘 Cycle and I have tried a different way of thinking.
Forget the usual 4 year halving talk for a second.
Look only at "Total Lunar Eclipses (Blood Moons)"
They come in clusters (groups of 2-4) and long gaps (no Blood Moons)
Every gap so far = Massive Bull Run 📈
43× → 10.8× → 4.53×
Every cluster so far = Big Drawdown 📉
–54% → –65% → –52% → –29%
(Tops always form inside or right before a cluster)
Right now (July 2026) we are inside the longest gap ever recorded = 1,034 days (normally ~856 days)
This gap started right after the 3 March 2026 Blood Moon and runs until 31 December 2028.
What the model says for the next 6 years
----------------------------------------------
▶️ Now → late 2028
→ Continued expansion (bull market). New highs expected
▶️ Late 2028 – end 2029
→ Next Blood Moon cluster
→ distribution & drawdown
▶️ 2030 – early 2032
→ Fresh expansion (another bull)
▶️ 2032 → Next cluster
→ another top & correction
Blood Moon Gap & Cluster Ladder
-------------------------------------
(the bull runs – no Blood Moons)
Every gap has been pure expansion, but the returns keep getting smaller
G1 (2015→2018) = 43× in 2.3 years
G2 (2019→2021) = 10.8×
G3 (2022→2025) = 4.5×
G4 (now → Dec 2028) = longer gap (1034 days). Model says ~3.2× → ~$192k
G5 (2030→2032) = ~1.9× → ~$283k
The yearly speed is slowing
5×/yr → 2.8× → 1.9× → now only ~1.5×/yr
Cluster Ladder = the drawdown windows – Blood Moons active
Every single cluster ended lower. Depth is also getting milder
A–C = –50% to –65%
D (2025-26) = –29%
E (Dec 2028–Dec 2029) = expected ~–40% off the top
Tops keep printing later inside the cluster. Simple Forecast Way points from today ($65k)
Late 2026 = possible dip to ~$58k
Mid 2027 = local high ~$97k
31 Dec 2028 = G4 ends → ~$192k
Jul 2029 = Cycle top → ~$263k
Dec 2029 = Cluster ends → ~$152k
Apr 2032 = next gap ends → ~$283k
Late 2032 = higher top possible → ~$363k
REMARK: This is pure speculation based only on the Blood Moon gap/cluster pattern. Not Financial Advice.
Walking up and down the stairs non-stop for 40 minutes at home has become my routine and favorite workout.
I end up sweating like I’m sitting in a sauna 🧖♀️ such an awesome feeling!
I haven’t tried Zebec card yet (and I plan to try it soon once $VELO virtual debit cards become available) but this is what I know from my friend
My friend used it so he can spend his crypto directly without needing to exchange it for fiat while traveling abroad on holiday. He used it everywhere in Thailand 🇹🇭
It’s a virtual card on his mobile phone, so it’s convenient and easy.
Mastercard is accepted worldwide, and that’s the merchant network Zebec cards use.
$BTC
The Blood Moon Cycle Model Key Points🌒
----------------------------------------------
🌒 Gaps (no blood moons) = bull phases
🌒 Clusters (blood moons active) = bear phases
🌒 Halvings only reinforce expansions (they always land inside gaps)
Where we are right now
--------------------------
🌒 Gap G4 started 3 Mar 2026 at = ~$59,930
🌒 Today (~5 months in) = $64,858
🌒 This gap is longer than usual (1034 days vs normal ~856)
🌒 Model target: ~$192k by 31 Dec 2028
Biggest historical observations
----------------------------------
🌒 Every major bull run happened in a gap
🌒 Every cycle top printed inside (or just before) a cluster
🌒 Multiples are shrinking: 43× -> 10.8× -> 4.5× -> projected 3.2×
🌒 Drawdowns are also getting milder
What to watch next
---------------------
1. Continue higher through 2027–2028 toward ~$200k zone
2. First blood moon of next cluster (31 Dec 2028) marks the likely end of this expansion
3. Cycle top expected mid-2029, then milder drawdown
$BTC 🌘
The Blood Moon Cycle Model (Shorter Version)
What the model says for the next 6 years
----------------------------------------------
▶️ Now → late 2028
→ Continued expansion (bull market). New highs expected
▶️ Late 2028 – end 2029
→ Next Blood Moon cluster → distribution & drawdown
▶️ 2030 – early 2032
→ Fresh expansion. Another Bull
▶️ 2032 → Next cluster
→ another top & correction
Simple Forecast Waypoints from today ($65k)
-------------------------------------------------
Late 2026 = Possible dip to ~$58k
Mid 2027 = Local high ~$97k
31 Dec 2028 = Gap Expansion ends ~$192k
Jul 2029 = Cycle Top ~$263k
Dec 2029 = Cluster Ends ~$152k
Apr 2032 = next Gap-Expansion ends ~$283k
Late 2032 = Higher Top possible ~$363k
Incredibly excited for the launch of @TradePools!!
This rollout has been absolutely insane. Degens discovered earlier versions of the smart contracts and traded over $150m in trading volume before the UI even went live
This created a unique challenge where we had to update our site and indexing to support both the earlier test versions and the final versions of the contracts at the same time, which added some additional time to the launch
People have used uniswap as both a launchpad and launchpad infra for over 8 years. We're excited to be building alongside all the other launchpads to move the space forward
What most sets https://t.co/wEWmXIGbvx apart?
- no added launchpad fee, just the normal protocol fee that comes with all v4 pools. This makes the launch pool way better for traders, with total spreads far lower than most launchpads
- autocompounding liquidity (excited to bring this feature to normal Uniswap LPing as well)
- permanently locked liquidity for all launches
- two launch methods: instant launch works similar to other launchpads, and crowd launch simplifies what we built with CCA to create a fairer, more bundle resistant launch method
- deep integrations and distribution: Pools has day one support across uniswap web app, wallet, trading api, all third party trading api integrations, bitget, fomo, gmgn, okx wallet, etc, with more coming online rapidly
Have seen various takes claiming incorrect fee splits - to be clear the 0.25% LP fees autocompounds to the locked liquidity pool, it does not go to the uniswap team. This becomes 20% to the creator and 80% to the liquidity compounding mechanism
Uniswap Labs team has been cooking hard on this one but its still in beta. We intend to ship a constant stream of upgrades and improvements from here. So please share any feedback!!
$VELO l @veloprotocol l @VeloOfficial_KR
I have a friend who uses the Zebec card $ZBCN and told me it’s great. I haven’t had a chance to try it yet, but now I finally have a reason to use it!
Looking forward to testing it soon 🙂
Here are the details of both the Silver and Carbon cards 💳 which will be available for $VELO 🔥
.@veloprotocol has selected Zebec as its exclusive card partner to launch a Velo-branded card experience, connecting Velo's PayFi infrastructure with real-world spending through Zebec Cards.
The integration will support:
• Silver and Carbon cards
• USDT and USDC funding
• BNB Chain, Ethereum and Tron
• USD, EUR and GBP balances
• Apple Pay and Google Pay
• Topping up the card using $VELO
Together, Zebec and Velo are building more ways for digital assets to move beyond the blockchain and into everyday crypto use.
My opinion on $FET price action
If price continues to drop and fails to hold the 0.11 level, there is a possibility that it could retrace further to the 0.05–0.07 range which is the monthly demand zone.
$DMTR l @dimitratech 🥑
In Kenya 🇰🇪 smallholder farmers work with "One Million Avocados" on Dimitra’s Connected Farmer platform.
Every tree is recorded as a Real-World Asset, complete with GPS location, photos, health data, and ongoing updates.
Farmers use the mobile app (it works offline and in Swahili) to map trees, log soil and crop conditions, upload progress photos, and get AI recommendations for pest control and care.
IoT sensors and satellite imagery feed in extra real-time insights, while blockchain locks everything in so the data can’t be changed.
The result is practical and productive ✅
Full tree-level traceability from orchard to buyer, better pest control, stronger market access, and real utility for $DMTR token.
A traceable avocado is a trustworthy AVOCADO🥑
https://t.co/wD6lwkJe9M
#NationalAvocadoDay is really about the people who grow it.
In Kenya, smallholder farmers work with One Million Avocados on Dimitra's Connected Farmer platform, where RWAs record avocado trees for pest prevention and traceability, the same data that gives $DMTR its utility.
Here's to the farmers behind every avocado. 🥑
$DMTR #Avocado #NationalAvocadoDay #DMTRTeam #DíaNacionalDelAguacate