A new study challenges how we think about momentum.👀
In U.S. equities, 12-month momentum is weak at predicting returns. Instead, it’s a strong signal of risk.
Negative momentum tends to be followed by higher volatility, while positive momentum is followed by calmer markets.
Long-only momentum improved Sharpe ratios mainly by stepping aside before turbulent periods — performing similarly to pure volatility timing.
This suggests momentum works better as a regime detector than a return predictor.
The better question isn’t “Will prices keep falling?”, but rather:“Has the market entered a state where holding the same risk is no longer worth it?”
Paper: https://t.co/fjK9L1tFmp
What’s your take — momentum as a return signal or a risk signal?
The market paid investors while they slept👀
For one historical U.S. sample, the equity premium did not arrive gradually through the trading day.
It arrived between the closing bell and the next opening bell. Daytime returns were close to zero—and sometimes negative.
Using transaction-level data, the researchers found the night/day split across individual stocks, indices and equity-index futures, on both NYSE and Nasdaq.
Part of the effect came from high opening prices fading during the first trading hour.
This is not a timeless instruction to buy every close. It is a warning about averaging unlike return-generating periods together.
Separate close-to-open from open-to-close, include auction spreads, and ask where your strategy actually earns its money.
Paper - https://t.co/fmYdEzJzo3
@localminimaa The edge isn’t running more agents. It’s enforcing strict trial counting so your pipeline kills its own datamining before reaching capital.
Exactly. An edge isn’t killed by being fake — it’s killed by working. Every fill you take is simultaneously collecting your profit and closing the mispricing that created it.
The only sustainable edge isn’t finding the perfect signal. It’s building a repeatable process for discovering the next one before the crowd finishes draining the current one.
This is one of the cleanest explanations I've seen on why most traders eventually blow up. The hardest part isn't understanding these concepts intellectually. It's actually behaving like you believe them. The real edge is having rules and processes that override that instinct even when it feels wrong. Most people read this and nod. Very few actually trade like they believe it.
@mindarchx Exactly. The position is just the visible output. The real trade is the probability you assigned to how the other side would behave. Two desks can look at identical data and both be 'right' because they’re implicitly betting on different distributions.
David Spiegelhalter, Cambridge statistician:
"Give me 10,000 traders and I'll show you a genius with a flawless five-year record, built by luck alone. I can even tell you how many to expect."
With enough people flipping coins (or trading), someone is guaranteed to string together a perfect multi-year winning streak.
Not because they're a genius — but because large samples make extreme outcomes inevitable.
That person writes the book, sells the course, and gets celebrated as living proof that the strategy works.
In reality, it was just arithmetic + survivor bias.
The lesson: You can't judge whether something is skill or luck by how impressive it feels. You have to calculate it.
Ask the real question: How likely was this streak if the person had zero edge?
Until you can answer that, a hot run isn't evidence of anything.
Do the math your gut doesn't want to do.
The humility to run it on your own success (or someone else's) is rare — but it's the only way to separate real edge from lucky fools.
Did trend work, or did its sizing work?👀
A strategy that combines a direction signal with volatility targeting can deliver a strong Sharpe ratio.
But which part actually deserves the credit? If you never separate the signal from the sizing, it’s easy to spend years improving the wrong component.
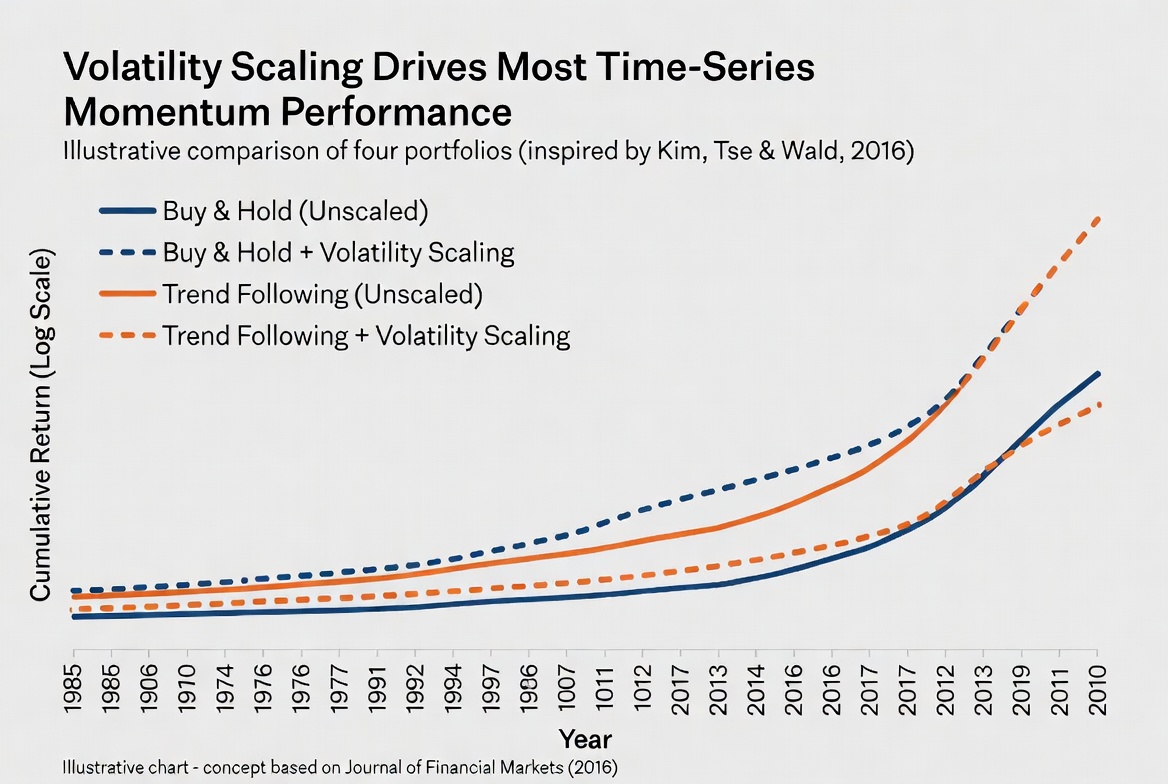
A major replication study showed that the celebrated alpha of time-series momentum was largely driven by volatility scaling.
Without the scaling, unscaled trend produced cumulative returns and alphas that were statistically similar to buy-and-hold across most futures sectors.
This doesn’t make trend useless — it simply changes the experiment. To properly answer the question, test these four portfolios side by side:
Buy-and-hold (unscaled)
Scaled buy-and-hold
Unscaled trend
Scaled trend
Only then can you see whether the edge comes from the direction signal, the risk allocation, or their interaction.
Test it for yourself, the paper is behind a paywall, but the logic still stands.
Paper: https://t.co/XFIIYzXlh9
@undefinedKi A lot of people think the hard part is finding good signals. The actual hard part is building a sizing framework that doesn’t let you overexpose in high vol or under-expose during real trends.
@sopersone The fact that time-series momentum shows up individually in almost every liquid futures market (equities, FX, commodities, bonds) and then gets even stronger when you diversify across them is what makes it genuinely impressive.
Pairs trading is not correlation trading. 👀
“These two stocks are correlated” is not a pairs-trading thesis.
Correlation only tells you that two returns moved together.
It says nothing about whether their price relationship is stable, whether a divergence is statistically unusual, or whether you can actually trade the convergence profitably after costs.
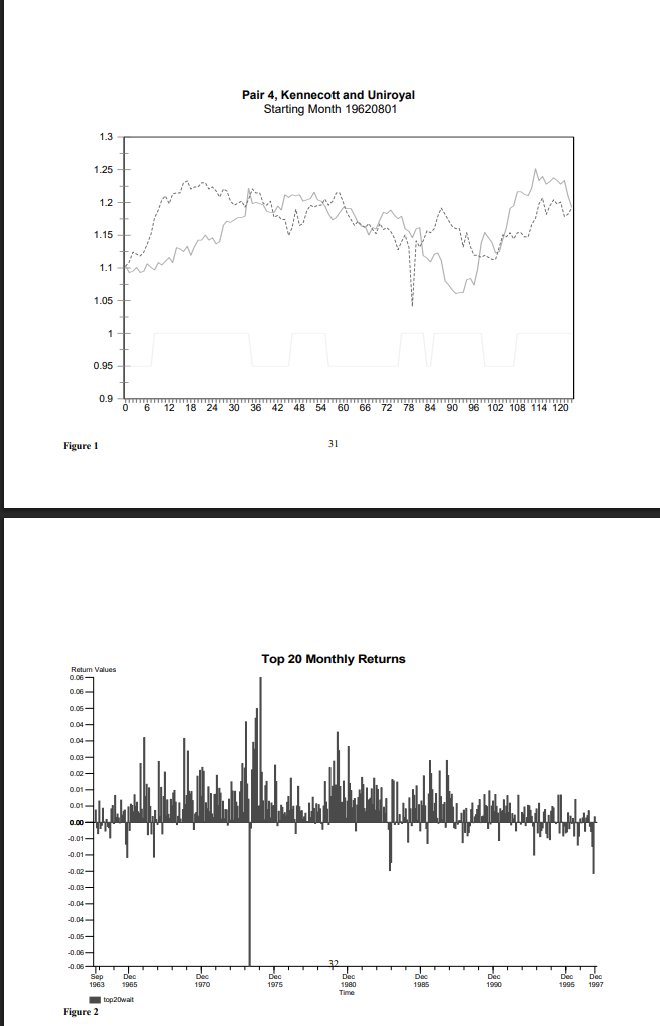
The original study matched stocks by minimum distance in normalized price history, then traded deviations over six-month windows.
From 1962–1997, top-pair portfolios delivered annualized excess returns of up to 12% before full implementation realities.
Even after conservative transaction costs and bid-ask adjustments, returns stayed positive through most of the sample and outperformed random-pair bootstraps—indicating the edge came from relationship stability, not generic mean reversion.
The test is cointegration-style stability, not a correlation screenshot.
Paper - https://t.co/kkmOkVSslB