📢Here you have my 2025 personal performance!!
US small cap Equities in base currency EUR (not hedged)
+41.78% YTD
SP500 in EUR: 3.93%
Not bad performance overall
December went like this 📈📉😂
I’m ready for 2026 🚀
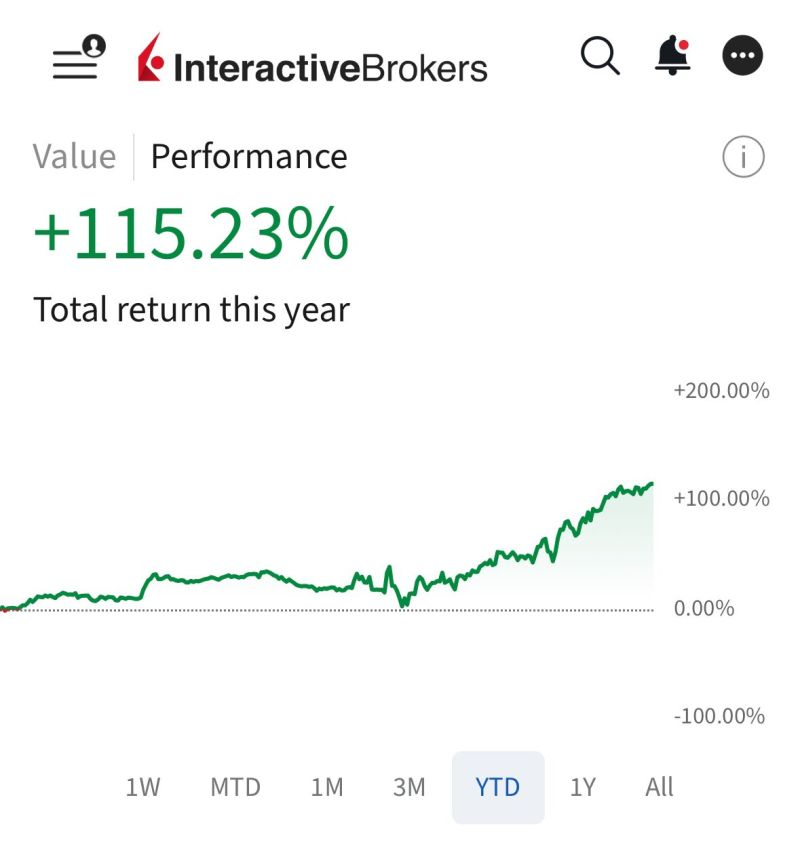
📢 I’m excited to share my performance compilation for the year 2024!
📈 This year, I have delivered an impressive +115.23% return on my account.
I have successfully more than doubled my initial investment since the start of the year.
🧵👇
Systematic investment research, engineered with discipline.
Coaching and consulting in factor investing for equities, for investors who prefer evidence over intuition.
Free 45-minute introductory consultation. No commitment.
quantsolvings .com
If you want to know what we typically cover in that call before booking, drop a comment and I'll walk you through it.
$DELL is up 234% YTD.
The company reported Q1 FY27 last Thursday. Revenue $43.8B vs $35.7B expected. EPS $4.86 vs $2.94. AI server revenue +757% YoY. AI backlog at $51.3B.
The stock printed its best single day ever the next session (+32.76%).
Here is the part most people miss. This is not a story about catching a winner. It is a story about how fast the analyst community had to rewrite its priors.
Price Target Mean revisions spiked to +201 in a few sessions. Current year EPS estimates jumped almost 40 points. Current quarter EPS expectations are up 62% from 13 weeks ago.
Even after a 234% run, the stock still trades 14% below the mean price target and 60% below the high.
This is exactly what factors like Analyst Estimate Revisions are designed to capture. Not the news. The slope of the revision wave that follows the news.
The momentum is real because the fundamentals were repriced.
How are you positioning yourself in this kind of trending environment?
@gary_spink@nkreu113r This is one of the few systems I developed at the start of my journey using data mining techniques instead of the current methodology I follow. I looked for the perfect model that could give me a 45% return in the backtest. As you can see, it’s garbage.
The most robust models are the ones that disappoint us the most.
A 15% annualized return on a clean, simple, well-reasoned model feels boring. So we start optimizing. We run grid searches. We add variables. We swap features. We tweak the lookback window. We rerun the backtest.
Suddenly the number reads 45%. And we feel like geniuses.
What we did was maximize the in-sample correlation between our inputs and past returns. What we lost was the original reason the model worked.
Correlations deteriorate. Causality persists.
The version with 15% would have kept producing 15% for years. The version with 45% will look amazing for six months and then quietly stop working, because nothing in it was actually anchored to anything real.
@Capital_Safari And look at the weight of the positions, with rebalance every 6 months. It’s a momentum model disguised as Value! 😂😂 Either way I believe it’s a good way to test our skills!!
$VLUE is up +46.29% YTD.
For anyone who has been telling me they want to start building factor strategies but don't know where to start, here's a project worth a weekend: rebuild it.
The prospectus tells you everything you need.
The MSCI USA Enhanced Value Index ranks each large and mid cap stock on three variables: price-to-book, price-to-forward-earnings, and enterprise value to cash flow from operations.
Then it weights by value score multiplied by market cap, and renormalizes so each sector keeps the same weight as the parent index. That last part is what most people miss. The factor is built sector-neutral, not free-floating.
Around 149 names. 30% annual turnover. Semi-annual rebalance.
When you don't know where to start, the cleanest path is to copy something that already works. You learn more replicating a real product than spinning your wheels on a blank page.
How close can you get to $VLUE inside @P123Finance ?
Drop your screen results in the comments.
17 months of factor performance in US large caps.
The numbers, rebased to 100 on Dec 31, 2024:
Momentum: 145.9 (+45.9%)
SPY: 129.1 (+29.1%)
Value: 125.1 (+25.1%)
Quality: 112.5 (+12.5%)
Low Beta: 110.7 (+10.7%)
Momentum beats SPY by 16.8 percentage points. Value is just below. The defensive factors, the ones that are supposed to do well when things get hard, are the worst performers of the period.
And this period includes a real test. The tariff-driven drawdown of March and April 2025 took Momentum down to 80 from 100 in a few weeks. It was the deepest hole. It also came back the strongest.
That's the part most people miss about Momentum. It's not that it doesn't drawdown. It does. It's that the same drivers that produce the drawdown also produce the recovery, because the regime hasn't actually changed.
If you want all the P123 screens behind these long-only factor portfolios, drop your P123 username in the comments and I'll send you an invite to my research group, where they're all available.
Momentum has been the best place to be in US large caps so far this year.
Long-only momentum on the Top 1,000 US equities is up +20.71% YTD.
SPY is up +9.00%.
That's a +11.71 point spread in roughly five months.
And it's not a one-year story. Momentum beat SPY in 2024 (+32.79% vs +24.88%) and again in 2025 (+19.13% vs +17.72%). Three years in a row.
There's a structural reason this keeps happening. SPY is market-cap weighted. When a stock goes up, its weight in the index goes up too. The benchmark itself has a built-in momentum tilt.
That's part of why beating SPY is so hard. You're not competing against a passive vehicle. You're competing against a passive vehicle that already loads on the same factor you're trying to harvest.
What pure momentum gives you is concentration in the same effect, without the dilution of holding 500 names where the bottom half barely moves.
The question I keep asking myself: does this hold to year-end, or do we get the kind of rotation that has punished momentum at past macro inflection points?
What do you think?