This is VERY bullish….
I am pumped to finally announce that I have launched my own private substack publication - Syko Therapy.
And to celebrate, the first 50 to subscribers will get 50% off a whole year!
Syko Therapy is a subscriber only newsletter/publication where I will be providing my similar data backed, non-emotional and objective analysis as I do on X, just with 10x the detail and depth, helping you navigate this space properly.
If you enjoy my content, want to massively level up your skills and drown out the emotional chaos of the timeline(there has been so much lately), then this is 100% for you.
And it’s all for the price of less than 1 Coffee per week(I want this to be affordable for all of my followers here).
Just jump down to the next tweet in this post and click the link to subscribe, and upgrade to paid to access it.
More info: What exactly will you get?
This newsletter will be sent multiple times per week, with no set timing, just as and when it’s most important to provide analysis or when I have something to say(which is all the time, haha).
It will include overall market technical chart breakdowns and projections, macro/liquidity outlooks, key on-chain metrics, and market Sykology wisdom, to help you cut through the noise and maximise every part of the cycle and your overall investing journey.
In addition, there will be educational videos of macro/technical breakdowns, helping teach you to fish yourself, and not be dependant on anyone else’s analysis!
Why am I doing it?
I have made the decision to launch this private publication as a place where I can provide my maximum effort and value to those that actually want it. And substack enables me to go deeper into my analysis and provide longer form content, whilst also being rewarded for my time.
I have been doing this for years now 100% free, but as my account has grown on X there are many who don’t appreciate the value I provide, so I will now be reserving it for those that do see value enough in it to pay for it, and that ultimately join my publication.
I will still be posting similarly on X, but my deep analysis and market overviews will be provided on Substack.
I hope to see many of you there.
It is honestly wild.
I wish I could fit all of the similarities on one chart, but it is simply not possible.
Just look at 2019/2020 here for:
- OTHERS.D
- BITCOIN
- SPX
In 2020 OTHERS.D bottomed as BITCOIN topped, and during the time Bitcoin was correction, SPX was outperforming.
Just like we have had recently.
It is the exact same setup.
Everyone thinks something has broken because we have had:
- A weak Bitcoin high
- Weak Altcoins
- Decoupling from equities
But is is the exact same thing that happened in 2019/2020 when Bitcoin mid cycle topped.
It is all there for anyone with eyes to see and ears to listen.
And yet, no one wants to accept this.
if you enjoy this kind of in depth analysis, make sure to subscribe to my newsletter.
I cover this kind of thing in much more details every single week!
Join here -> https://t.co/L6DvuFDLcP
One of the strongest reversal indicators fired two weeks ago.
This is the most reliable reversal indicator i have found to date.
If you sold heavy or bought heavy every time these occurred, you would win very well.
As you can see it mainly triggers on highs, and it catches pretty much every single major high.
The only time it has flashed a bottom signal is:
- 2022 low
- Two weeks ago
What is also interesting is that both of these bottom signals are accompanied by a bullish divergence.
I'm not really not sure how anyone can deny it.
Where we are is almost an exact mirror of 2019/2020.
This is mid cycle correction and we are going to go on and achieve a full cycle high next.
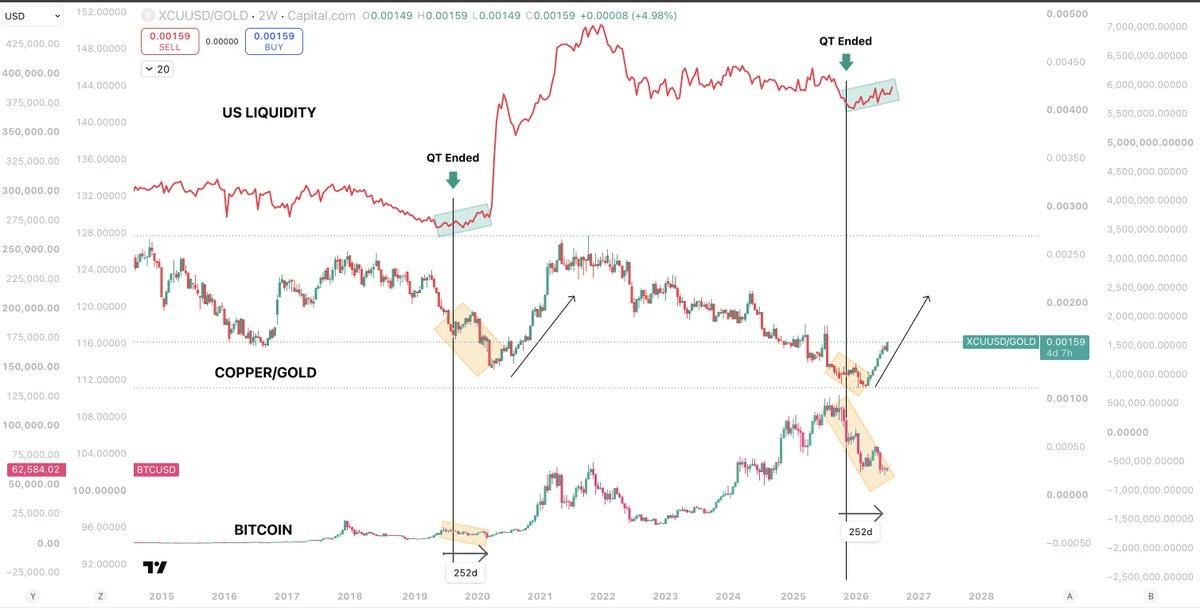
In this chart US Liquidity and Copper/Gold show us where we are.
Not only are they both in the exact same position, Bitcoin has also completed the exact same correction.
We now have Copper/Gold and US liquidity turning up, just like they did before Bitcoin in 2020.
These similaritoes are uncanny.
You cannot find anywhere near this level of similarity from anywhere else in Bitcoins history.
We may have corrected along the lines of the 4 year cycle expectations, but the road to ATH will be a lot faster than most people think.
This is still my main idea for $BTC.
I am 90% that the macro low is in.
I give 10% to the Realised cap being tested at $54k.
But outside that, I think we get a triple tap here on Bitcoin before running it up to $70,000.
My Bitcoin relative strength indicator has flashed a quadruple buy signal and its never let me down.
I also think the bearish cries will be very loud at $60k.
I am extremely bullish on $EDEL.
This aint your average Crypto token fam.
$EDEL is the only project that has launched on @CantonNetwork with a token.
What makes this such a big deal is that names like JP Morgan, HSBC and Nasdaq are either validating or building on the network.
Canton has built the institutional grade privacy chain for institutional flows.
Large institutions need privacy.
@edeldotfinance Has built the perpetual/lending & borrowing tokenised equities exchange, on Canton.
Canton is the bridge for institutional flows and Edel is the exchange that provides the platform for those flows.
It's an incredibly massive project that hardly anyone understands.
And it's market cap is $7m.
Thank the bear market for opportunities like this one.
If this continues to push things are about to get spicy for altcoins.
ETH/BTC, for the first time in 11 months, has broken above its downtrend.
This is not 2022 guys.
After the 2022 bear market low, Bitcoin went on to be highly dominant for years.
Now, after this $60k BTC macro low, as we are teasing pushing higher...
ETH/BTC is breaking out.
What this is showing us is that on any decent move higher, ETH is going to outperform.
And as I believe will happen, this will begin the second part of this cycle...
The part we have been missing.
The mid cycle correction only continues to build weight here.
Soon we will find out.
This is a huge data point to understand.
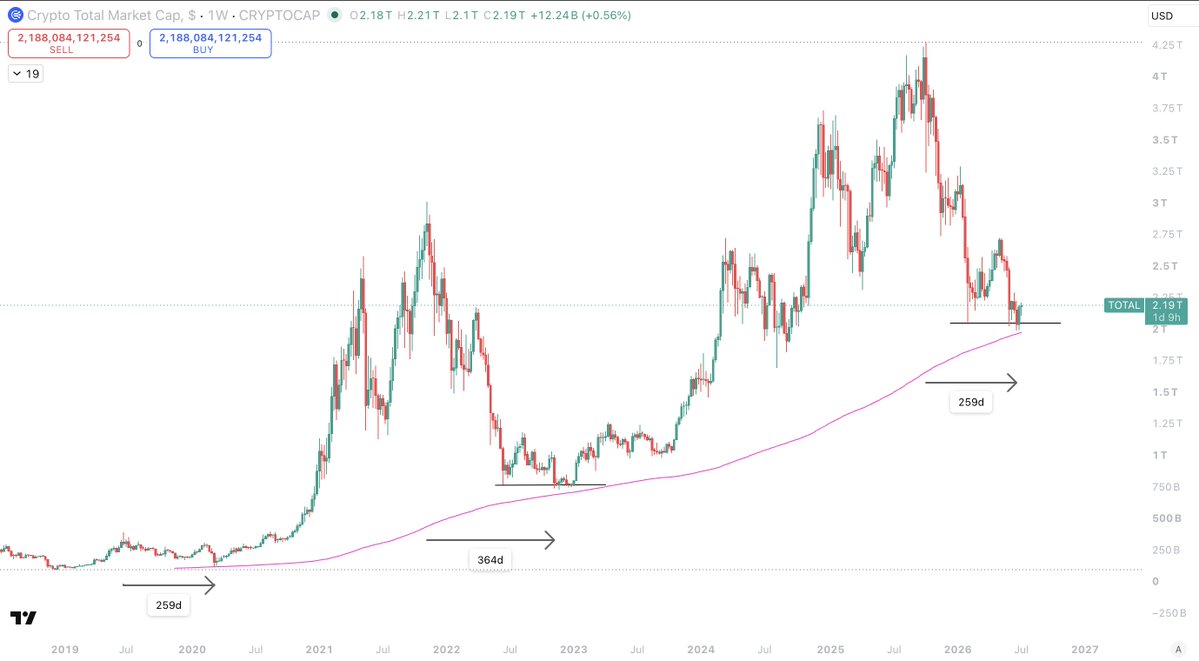
The TOTAL Crypto market cap has reached the same levels of oversold as both the:
- 2020 COVID low
- 2022 Bear market bottom
It's actually overextended the 2022 bottom.
And this is based on the 1W 300D SMA.
But what is most interesting about this chart is how this Bitcoin bottom has combined different elements from 2020 and 2022.
We have a macro low sweep + 1W Bullish divergence like we did in 2022.
And we have a shorter time period to the bottom, 259 days, like we did in 2020.
As my loyal followers will know, I believe we have bottomed faster because where we are is actually a mid cycle correction.
Bitcoin has never gone below the 1W 300 SMA.
Of course, we cant ever say it will not.
But its a very deep level that has always been respected, and only actually tagged properly once.
TOTAL looks bottomed.
It's getting serious now bois.
Quadruple buy signal on my Bitcoin relative strength chart.
What this is telling us is that smart money is heavily allocating into Bitcoin.
Price is being very resilient and also showing us big buyers are acquiring a lot of supply from the sellers down here.
Bitcoin feels like its reached a floor to me, and this kind of accumulation is a strong signal for that.
To gain more confidence in this we need acceptance back above $65,000, which I then think $70,000+ comes soon.
It's not looking bad.
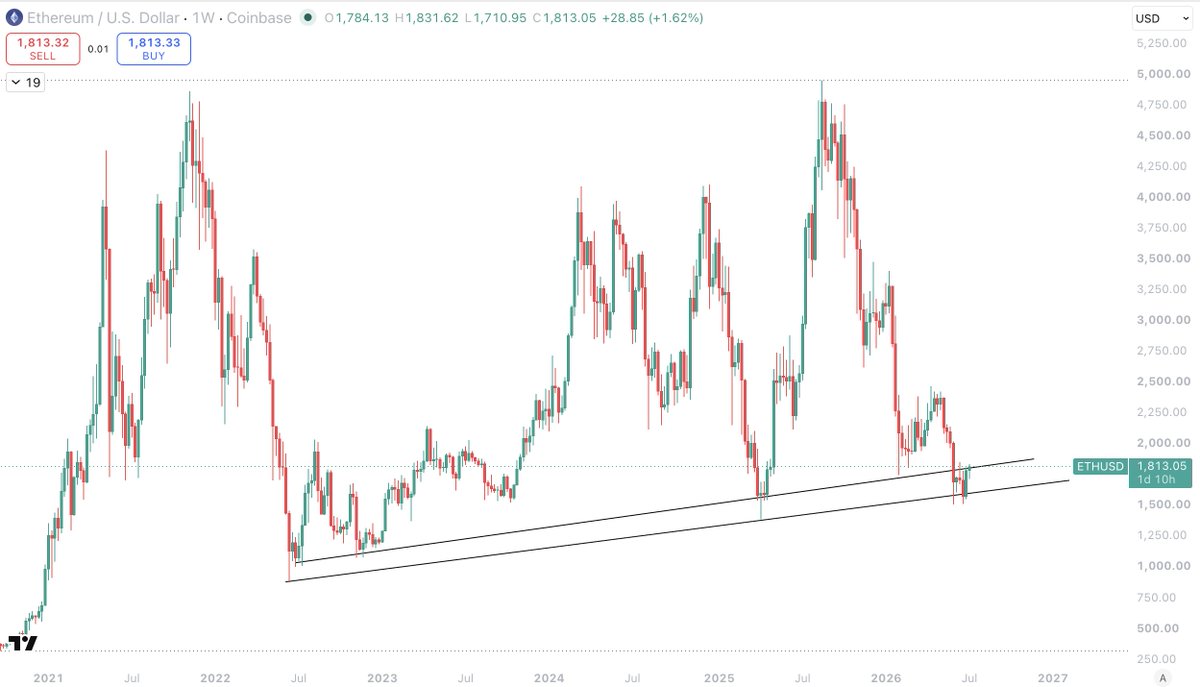
This is a massive level for $ETH.
Break back above $1,820 with strength and this recent breakdown is a deviation.
$ETH bottomed respecting the Wick low trend set back in the 2022 bear.
It's not trading:
1. Above the wick low trend from 2022
2. Below the recent range breakdown
3. Below the Candle body trend from 2022
Back above $1,820 and $ETH is back above them all.
ETH/BTC also signalling that this likely isn't a nothing burger.
Back above $1,820 and things improve quite quickly imo.
The markets do not care anymore.
War FUD, interest rate fears…
Doesn’t matter.
It’s not stopping the train.
Hate to break it to the doomers but SPX looks insanely bullish.
This is not a bearish chart sers.
Another big leg is loading for equities here…
And on this one Crypto isn’t just going to follow.
It’s going to outperform.
Still waiting for something like this to play out.
Some nice liquidity to the downside built up and $60,700 would be a tidy retest of the W bottom zone.
Basically, acceptance above $65,000 and we're good for higher.
Worst case scenario is The Realised Cap at $54,000.
All I'm doing is adding to my bags whilst we're offered these deep value prices.
Keen for a long into $60,700.
Let's see how it goes.
This is another incredibly undervalued gem.
$EDEL has released their @CantonNetwork-native perps DEX for institutional grade positioning with ultimate privacy.
Tokenised equity borrowing/lending/trading is an insanely massive market that has not been realised yet.
Canton is backed and validated by some of the largest institutions in the world, and @edeldotfinance is providing the tokenised layer for institutions to lend/borrow equities.
At $10m market cap this is silly undervalued.
Continuing to add to this as we round out a Market bottom on the coming weeks/months.
This is why I think $SERV is on its way to cross the $1bn threshold.
They're making moves that gets them closer and closer to the heart of enterprise AI sector, worth 300 billion dollars just this year.
Think about it - even 0,1% slice of that market leads to $75 million buyback of the token.
AI is also at the beginning stages of revolutionising banking/finance, a far larger sector, and OpenServ is already there, meeting the top guys and getting ready with all necessary compliance checks and expanding its network in banking globally.
Theyre about to drop v2 of SERV Reasoning, designed to tackle the exact issues with current systems - the costs are very high and the trust is very low.
Features in v2 are addressing these directly:
⁃ Graphs and schema enforcement allow you to use far smaller (and more cost-effective models)
- Multipath Reasoning and Shadow Agents target 100% reliable outputs.
⁃ Verification Hints (pre-output signals for correct results) reduce reworking and costs.
⁃ Benchmark Tooling lets users test cost savings/reliability on their own workloads before full integration.
Basically SERV has built exactly what the financial sector needs to solve the current problems with Agentic AI, among other industries.
Take some time to understand this space because I think it is an opportunity to allocate to a project that is exceptional and massively undervalued.
Im posting about this a lot because I genuinely think this is a very big deal.
You don’t get R/R like this often chads.
This is an alpha chart.
It tells us two very important things.
in the middle, in grey, we have the mean reversion index.
The Bitcoin Mean Reversion Index measures how far the current price of Bitcoin deviates from its historical moving averages.
Price spike up and down, but eventually always move back to the averages.
What we can see here is that the mean reversion index is already reverting back, in the exact same position it was during the lows of the previous bear cycles.
Its in an almost identical position to the low of 2022.
Secondly, at the bottom, we have the overextension and deep value graph.
We can see that in each cycle Bitcoin has made it into the very top level of this, representing Quantile 97+.
This time, it only reached 82.
So the reason Bitcoin has already begun mean reverting to the average, whilst on its lowest percentage bear cycle drop ever, is because it did not overextend in the same way.
The more something expands, the greater it will contract.
And this shows us that in actual data.
We dropped a bit lower here...
But I have added a bit more to my $SERV bag.
Looks like a bit of an ETH wide on-chain sell off happened?
Anyway, thanks for the entry. I think this is a good area.
$SERV has entered a continual DCA bag for me, so I'll keep adding gradually over time.
Not expecting new ATHs tomorrow and fireworks yet, but that is the game. We add and have patience.
Personally I do not see a greater R/R at these levels all things considered.
I think we end up $70k+ by the end of July.
I favour this path to get there.
But once we get a close above $66,000 lower targets really start to lose weight after this bottoming structure.
The realised cap at $54,000 remains my worst case scenario liquidity low sweep, and i think that will be short lived if it does happen.
Bitcoin at $54,000 would be Quantile 2, meaning only 2% of days bitcoin will averagely ever be as deep value as that.
A clean flush down to $60,700 would offer very high R/R longs and a level I am watching closely.
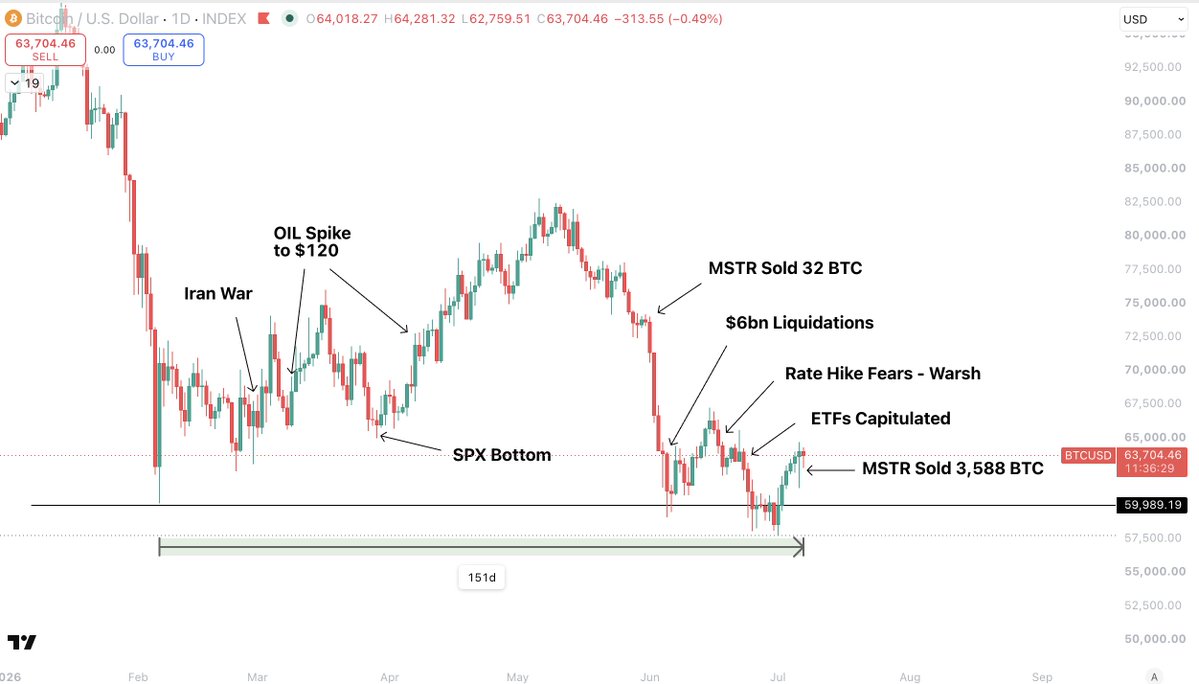
Nothing has been able to hold Bitcoin under $60,000.
I have been saying it for a long time, but now we can see just how strong of a floor it is.
Bitcoin has been respecting $60,000 as its HTF floor for 151 days.
During this time we have had:
- Iran war
- OIL spike to $120(twice)
- Equities drop
- Markets expecting rate hikes
- Saylor selling
- ETFs capitulating
And $60,000 has been defended.
The market has been saying that Saylor is the only buyer.
Well, Saylor just sold, and the ETFs have capitulated $7bn over weeks...
And the price went up yesterday.
So you bet your ass many others are buying these coins.
Bitcoin has had every reason possible to go under $60,000 and it has not happened.
When negative news like Saylor selling pumps the price...
You have to pay attention.
I cannot say for sure if the bottom is in.
But I can say that the bears have lost momentum and every single negative thing that has been thrown at Bitcoin has failed to drag it down.
What Bitcoin has endured over these 151 days, and stayed above $60,000, is insane.
Expecting it to go to the $40k's when you understand this, is misguided imo.
If price was weak, and wanted thos levels...
It would have already taken them.
This is looking solid.
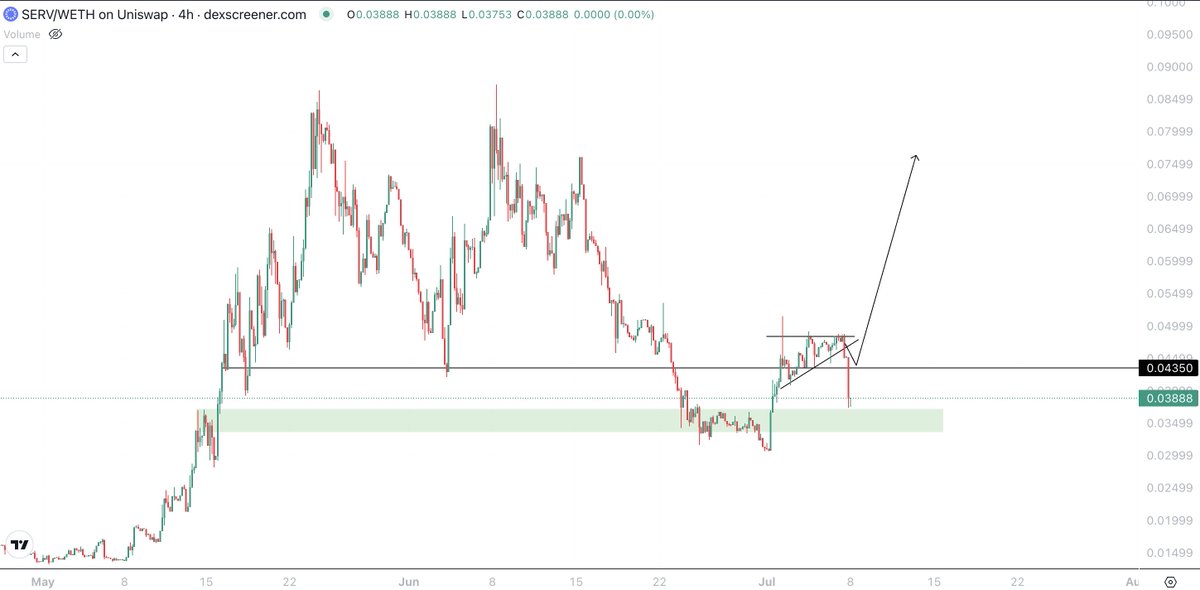
$SERV chart coiling here after reclaiming a very key level.
Possibility of a small flush below the wedge, before running it up to the highs.
Have been adding at these levels and will continue to do so.
Expecting decent new highs this year and for $SERV to outperform as the markets begin to trend upwards overall.