You've been conditioned to think that way.
The current situation in the $OIL market is highly irrational. The level of price suppression and market intervention we're seeing suggests just how much influence large financial institutions have over the paper market, allowing them to shape price action and chart structures to fit the narrative they want.
The problem is that the physical market—the part they don't fully control—is telling a completely different story.
The idea, promoted by countless media articles, that retail traders are simply pricing in peace is not consistent with how markets actually behave. After more than 10 years in this industry, I've seen all kinds of market environments, and one thing has always remained true: traders chase profit.
When traders see a clear bullish catalyst, they don't refuse to buy because they want to "price in peace." They often buy at irrationally high prices if they believe there is money to be made. I have never seen a market where traders collectively decided to ignore obvious fundamentals and trade against the facts simply because they wanted to discount a peaceful outcome. That narrative doesn't hold up.
Now look at the physical data:
Strait of Hormuz: 39 tankers in 31 days — approximately 1.3 per day, versus a normal average of around 21 per day, a 94% decline. The strait remains effectively closed, even seven weeks after the so-called "deal."
Bab el-Mandeb: 118 tankers, or 3.8 per day, compared to a normal average of roughly 8 per day — a 52% decline.
The clearest example came on July 20, when the Houthis announced a blockade of Saudi shipping. Ironically, 12 tankers passed through Bab el-Mandeb that day—the highest daily total of the month. Then on July 23, 24, and 25, traffic dropped to zero. Before the blockade, the average was 6.4 tankers per day. Afterward, it collapsed to 1.14 per day—an 82% drop overnight.
On August 5, zero tankers passed through Bab el-Mandeb. On August 5–6, zero tankers passed through the Strait of Hormuz.
And here's what matters even more than the raw numbers:
During this same period, Brent crude moved from $69 to $102, then fell back to $79—a 45% rally followed by a 22% decline. Yet tanker traffic remained at depressed levels throughout, with no meaningful recovery.
In other words, prices have been reacting to headlines about negotiations, while the physical flow of oil has not. The paper market is trading the narrative. The physical market continues to tell a very different story.
You've been conditioned to think that way.
The current situation in the $OIL market is highly irrational. The level of price suppression and market intervention we're seeing suggests just how much influence large financial institutions have over the paper market, allowing them to shape price action and chart structures to fit the narrative they want.
The problem is that the physical market—the part they don't fully control—is telling a completely different story.
The idea, promoted by countless media articles, that retail traders are simply pricing in peace is not consistent with how markets actually behave. After more than 10 years in this industry, I've seen all kinds of market environments, and one thing has always remained true: traders chase profit.
When traders see a clear bullish catalyst, they don't refuse to buy because they want to "price in peace." They often buy at irrationally high prices if they believe there is money to be made. I have never seen a market where traders collectively decided to ignore obvious fundamentals and trade against the facts simply because they wanted to discount a peaceful outcome. That narrative doesn't hold up.
Now look at the physical data:
Strait of Hormuz: 39 tankers in 31 days — approximately 1.3 per day, versus a normal average of around 21 per day, a 94% decline. The strait remains effectively closed, even seven weeks after the so-called "deal."
Bab el-Mandeb: 118 tankers, or 3.8 per day, compared to a normal average of roughly 8 per day — a 52% decline.
The clearest example came on July 20, when the Houthis announced a blockade of Saudi shipping. Ironically, 12 tankers passed through Bab el-Mandeb that day—the highest daily total of the month. Then on July 23, 24, and 25, traffic dropped to zero. Before the blockade, the average was 6.4 tankers per day. Afterward, it collapsed to 1.14 per day—an 82% drop overnight.
On August 5, zero tankers passed through Bab el-Mandeb. On August 5–6, zero tankers passed through the Strait of Hormuz.
And here's what matters even more than the raw numbers:
During this same period, Brent crude moved from $69 to $102, then fell back to $79—a 45% rally followed by a 22% decline. Yet tanker traffic remained at depressed levels throughout, with no meaningful recovery.
In other words, prices have been reacting to headlines about negotiations, while the physical flow of oil has not. The paper market is trading the narrative. The physical market continues to tell a very different story.
You've been conditioned to think that way.
The current situation in the $OIL market is highly irrational. The level of price suppression and market intervention we're seeing suggests just how much influence large financial institutions have over the paper market, allowing them to shape price action and chart structures to fit the narrative they want.
The problem is that the physical market—the part they don't fully control—is telling a completely different story.
The idea, promoted by countless media articles, that retail traders are simply pricing in peace is not consistent with how markets actually behave. After more than 10 years in this industry, I've seen all kinds of market environments, and one thing has always remained true: traders chase profit.
When traders see a clear bullish catalyst, they don't refuse to buy because they want to "price in peace." They often buy at irrationally high prices if they believe there is money to be made. I have never seen a market where traders collectively decided to ignore obvious fundamentals and trade against the facts simply because they wanted to discount a peaceful outcome. That narrative doesn't hold up.
Now look at the physical data:
Strait of Hormuz: 39 tankers in 31 days — approximately 1.3 per day, versus a normal average of around 21 per day, a 94% decline. The strait remains effectively closed, even seven weeks after the so-called "deal."
Bab el-Mandeb: 118 tankers, or 3.8 per day, compared to a normal average of roughly 8 per day — a 52% decline.
The clearest example came on July 20, when the Houthis announced a blockade of Saudi shipping. Ironically, 12 tankers passed through Bab el-Mandeb that day—the highest daily total of the month. Then on July 23, 24, and 25, traffic dropped to zero. Before the blockade, the average was 6.4 tankers per day. Afterward, it collapsed to 1.14 per day—an 82% drop overnight.
On August 5, zero tankers passed through Bab el-Mandeb. On August 5–6, zero tankers passed through the Strait of Hormuz.
And here's what matters even more than the raw numbers:
During this same period, Brent crude moved from $69 to $102, then fell back to $79—a 45% rally followed by a 22% decline. Yet tanker traffic remained at depressed levels throughout, with no meaningful recovery.
In other words, prices have been reacting to headlines about negotiations, while the physical flow of oil has not. The paper market is trading the narrative. The physical market continues to tell a very different story.
@MarioNawfal America has achieved absolutely no progress in this war and not a single goal that it set for itself. What kind of victory are we talking about?
@macropaperr Interventions are good for quick profits, but for long-term policy, interest rates need to be raised; otherwise, nothing will change globally.
https://t.co/NQllADeK6s
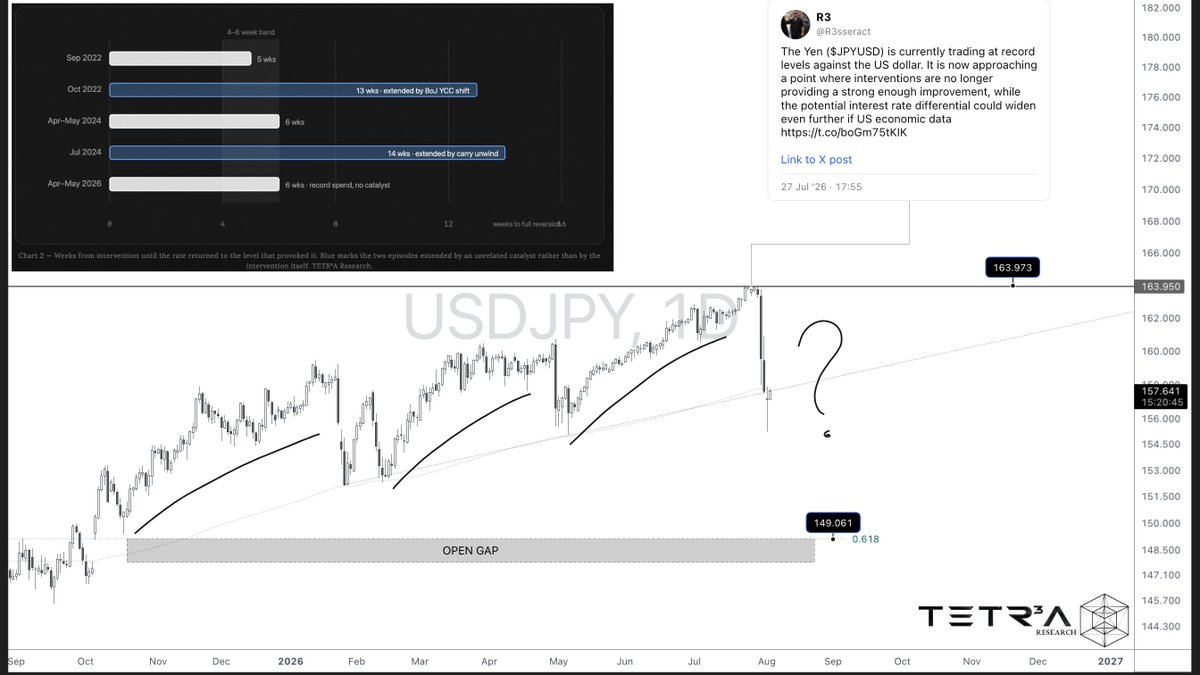
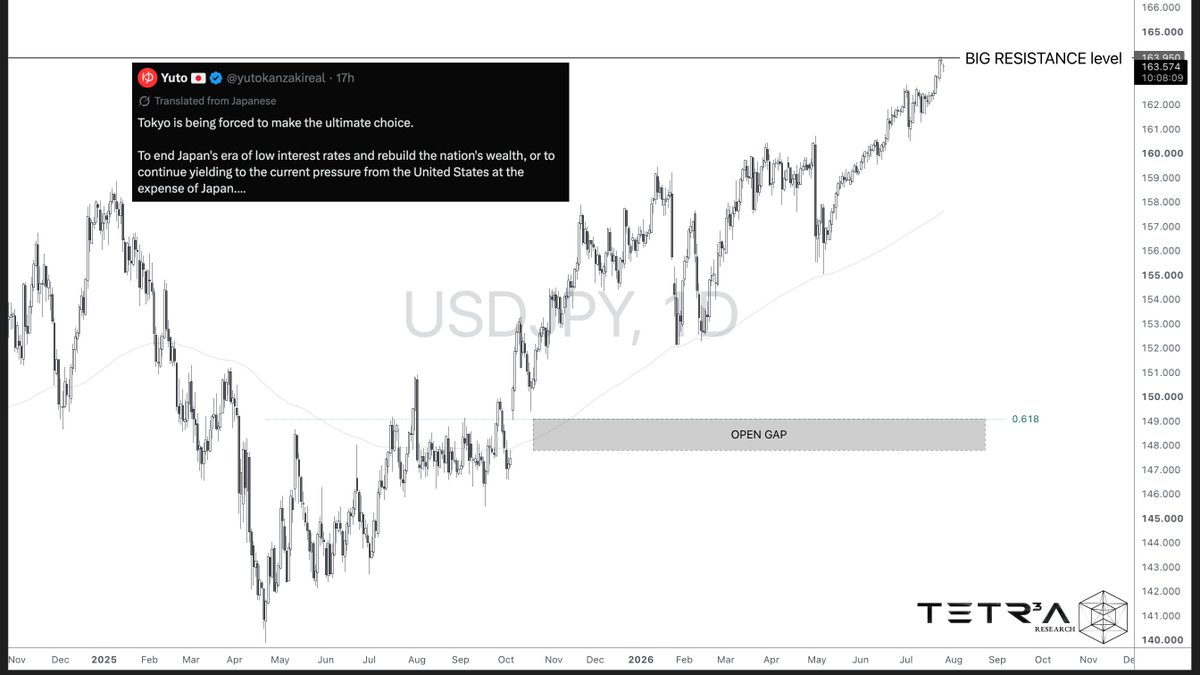
The Bank of Japan's decision did not fully reflect what the market had been expecting.
Our system anticipated currency intervention, but we also expected it to be accompanied by a more aggressive interest rate hike. That combination would have been ideal from a timing perspective, especially since both the Federal Reserve and the Bank of England kept rates unchanged, giving Japan a rare opportunity to narrow the interest rate differential.
However, a potential global energy shock could once again force major central banks to raise interest rates. If that happens, Japan may struggle to keep pace with the already wide rate gap.
As a result, the Japanese yen could gradually weaken back toward its previous levels unless the government and the Bank of Japan adopt a significantly more hawkish policy stance.
The Bank of Japan's decision did not fully reflect what the market had been expecting.
Our system anticipated currency intervention, but we also expected it to be accompanied by a more aggressive interest rate hike. That combination would have been ideal from a timing perspective, especially since both the Federal Reserve and the Bank of England kept rates unchanged, giving Japan a rare opportunity to narrow the interest rate differential.
However, a potential global energy shock could once again force major central banks to raise interest rates. If that happens, Japan may struggle to keep pace with the already wide rate gap.
As a result, the Japanese yen could gradually weaken back toward its previous levels unless the government and the Bank of Japan adopt a significantly more hawkish policy stance.
From a technical perspective, $USOIL currently has two unfilled gaps above the current price and one below.
Based on my system and the data available at the moment, the higher-probability scenario is a move higher, at the very least to fill the upside gaps. In the more bullish case, I see the potential for oil prices to rise toward the $100–120 range.
From a geopolitical standpoint, my view is that the United States has limited options beyond either escalating military action or stepping away without achieving its objectives. The latter could carry significant strategic consequences and weaken its global position
The Bank of Japan's decision did not fully reflect what the market had been expecting.
Our system anticipated currency intervention, but we also expected it to be accompanied by a more aggressive interest rate hike. That combination would have been ideal from a timing perspective, especially since both the Federal Reserve and the Bank of England kept rates unchanged, giving Japan a rare opportunity to narrow the interest rate differential.
However, a potential global energy shock could once again force major central banks to raise interest rates. If that happens, Japan may struggle to keep pace with the already wide rate gap.
As a result, the Japanese yen could gradually weaken back toward its previous levels unless the government and the Bank of Japan adopt a significantly more hawkish policy stance.
The Yen ($JPYUSD) is currently trading at record levels against the US dollar. It is now approaching a point where interventions are no longer providing a strong enough improvement, while the potential interest rate differential could widen even further if US economic data deteriorates and the Fed is forced to raise rates after all.
Accordingly, both my system and I are forecasting, with a high degree of probability, a more aggressive pace of rate hikes from Japan. The increase in debt does not necessarily mean that the economy will perform poorly. However, losses among the population and rising inflation could significantly worsen the country’s economic situation.
Therefore, I believe the choice here is quite clear. But for the rest of the world, carry trade positions will be built from an extremely elevated level, which could potentially trigger a chain of events that cools down markets and causes liquidity to start shifting from one asset class to another.
Statistics data for $USOIL show
Monday: 73.9% Down, 26.1% Up.
Tuesday: 43.5% Up, 56.5% Down.
Therefore:
The probability of a decline decreases from 73.9% to 56.5% (-17.4 percentage points).
The probability of an increase increases from 26.1% to 43.5% (+17.4 percentage points).
In other words:
Compared to Monday, the probability of an opposite (bullish) move on Tuesday increases by approximately 66.7%.
The logic is simple and checkable. Comparative inventory is current storage minus the five-year average for the same time of year. It is the market's savings account. When stocks sit comfortably above normal, the risk of shortage is low and prices tend to fall; when stocks fall below normal,
the market becomes anxious about supply security and prices rise. The relationship is almost always inverse and — critically — convex: each additional barrel of deficit is worth more than the last.
The curve is constructed by the author (class E) around two documented readings from the published work of Labyrinth
Consulting Services: at first-quarter 2026 comparative-inventory levels the curve implied roughly $70 for Brent (and about $75 for WTI), and at a sustained pace of draws the historical relationship carries WTI to roughly $150 by late November. Intermediate points are the author's interpolation along the convex shape. This is a trend line, not a regression: deviations from it are informative in their own right.