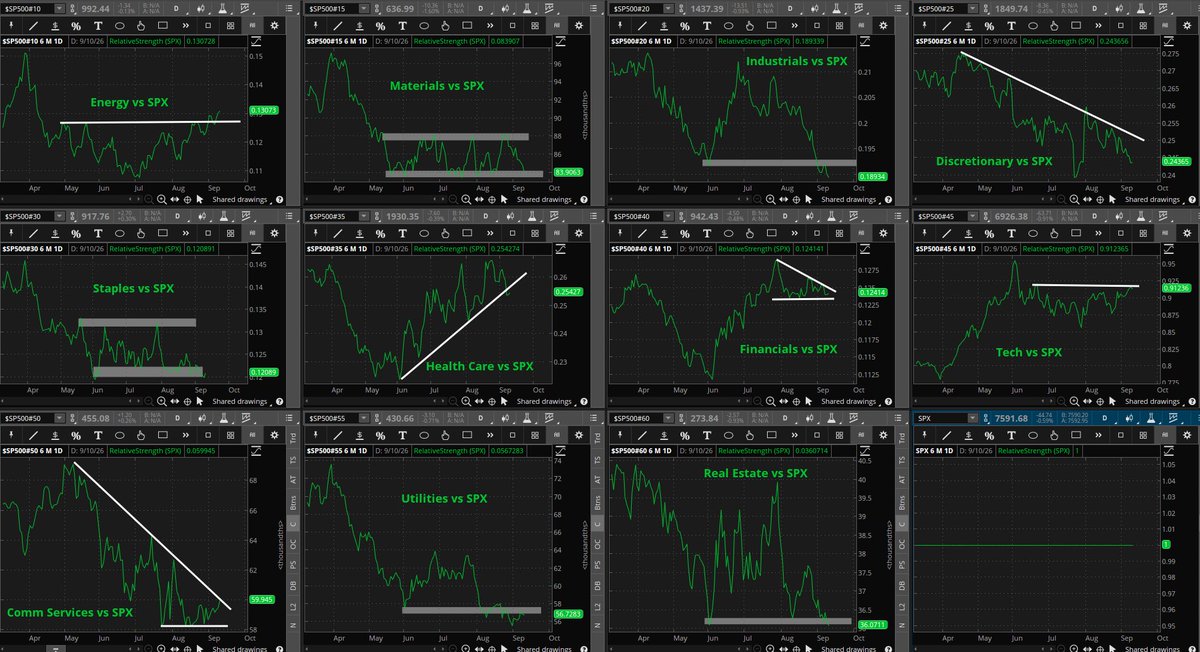
Sector trends relative to $SPX
Schwab does not recommend the use of technical analysis as a sole means of investment research
All names and market data shown below are for illustrative purposes only and are not a recommendation, offer to sell, or a solicitation of any kind.
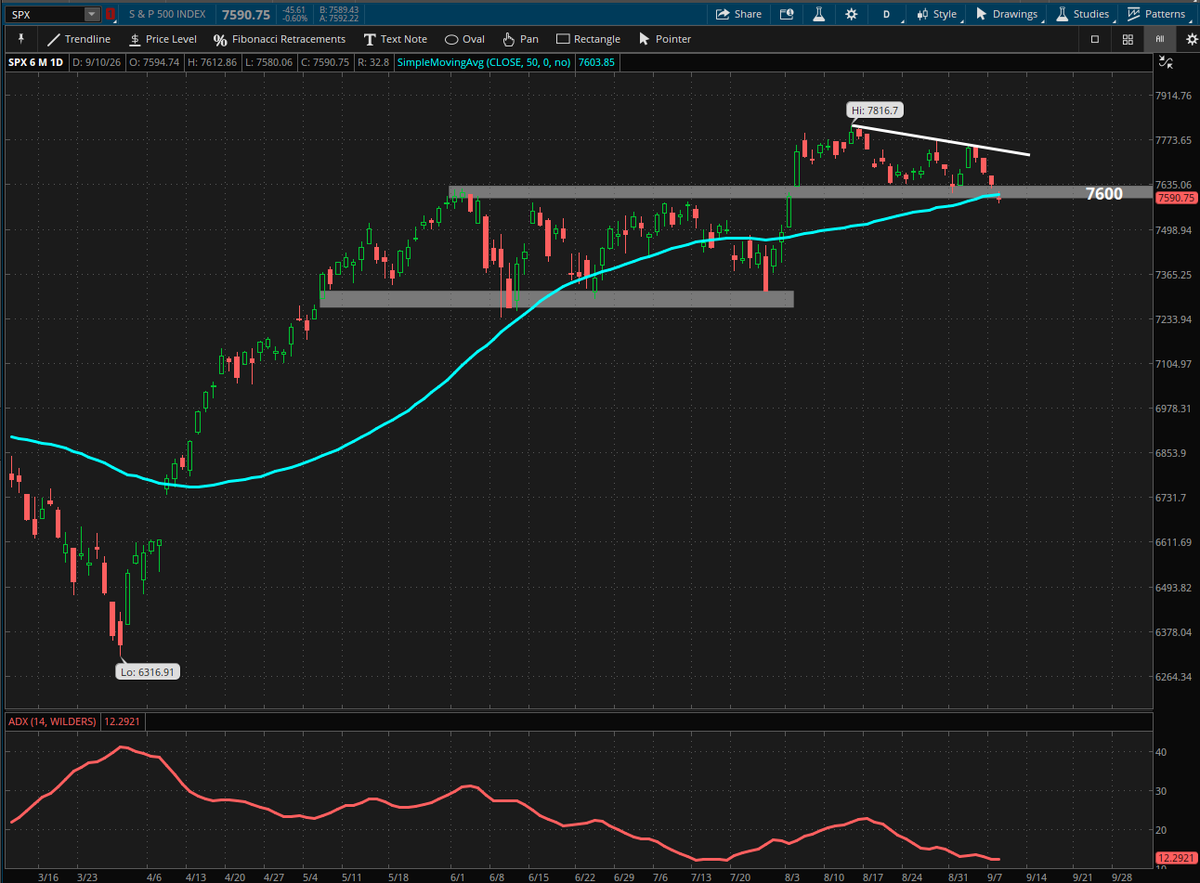
Chart of the day: $SPX
Today the S&P 500 gapped towards a confluence of support (prior highs and the 50-day) ~7600
With additional economic data and policy decisions looming ahead coupled with historical seasonal headwinds, will bulls step in to defend critical intermediate-term support?
*Schwab does not recommend the use of technical analysis as a sole means of investment research
*All names and market data shown below are for illustrative purposes only and are not a recommendation, offer to sell, or a solicitation of an offer to buy any security
*Chart source: thinkorswim
Today $CrudeOil prices broke decisively above old resistance ~$94, which may now act as new potential support. This development occurred on improving bullish momentum and an above-average increase in volume, factors that technicians may view as supporting evidence for the breakout.
The Average Directional Index (ADX), a commonly used measure of trend strength, has moved above 20 following nearly a month-long trough. This can be interpreted as an acceleration in a trend direction, which appears to be to the upside given the most recent price action.
Traders may look towards the next zone of potential resistance at prior swing highs, near the 161.8% Fibonacci retracement just above $105.
*Schwab does not recommend the use of technical analysis as a sole means of investment research
*All names and market data shown below are for illustrative purposes only and are not a recommendation, offer to sell, or a solicitation of an offer to buy any security
*Chart source: thinkorswim
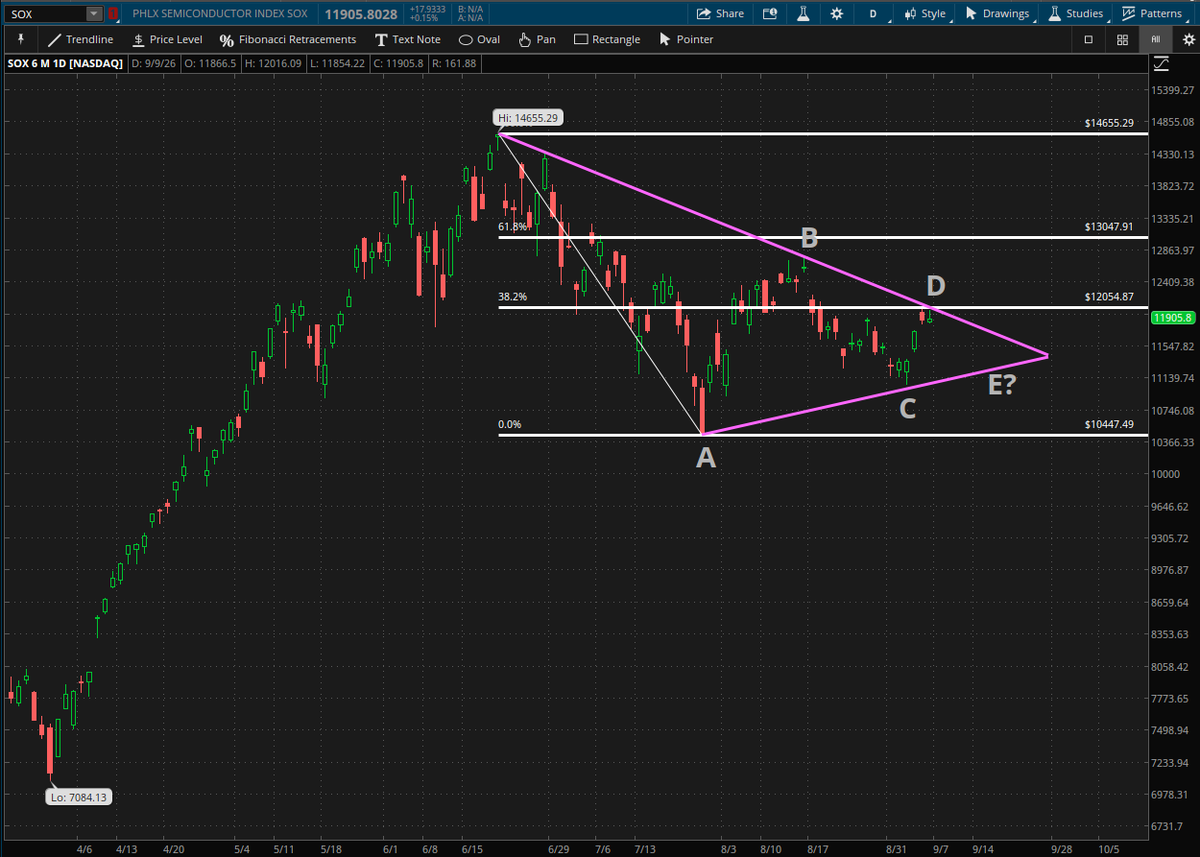
Chart of the day: $SOX
$Semiconductors are nearing the apex of their symmetrical triangle. As the index approaches this decision-making point, prices are sitting just below a confluence of resistance at descending trendline + 38.2% Fib retracement ~12,055.
When prices reclaim the 38.2% Fibonacci retracement level, it typically indicates to technicians that the deeper corrective phase is complete and the primary trend can resume. If this level fails, traders may imply that there may be one last corrective wave left in the asset.
Currently, the $SOX appears to be striking Wave D of a triangle correction, which is a 5-wave structure (A-B-C-D-E). Triangles are patterns which take time to develop. Quite often, a false breakout occurs on Wave D before a fast move down to the final wave, Wave E, before price resumes its primary trend. (Of course, there is no guarantee to this price behavior.)
Now today, prices appear to be forming a possible tweezers top (consecutive candlesticks with similar ranges) near this critical zone. Of course, the next couple trading sessions could provide traders with a definitive break in either direction and ultimately either confirmation or invalidation of this smaller candlestick as well as larger classical technical pattern.
*Schwab does not recommend the use of technical analysis as a sole means of investment research
*All names and market data shown below are for illustrative purposes only and are not a recommendation, offer to sell, or a solicitation of an offer to buy any security
*Chart source: thinkorswim
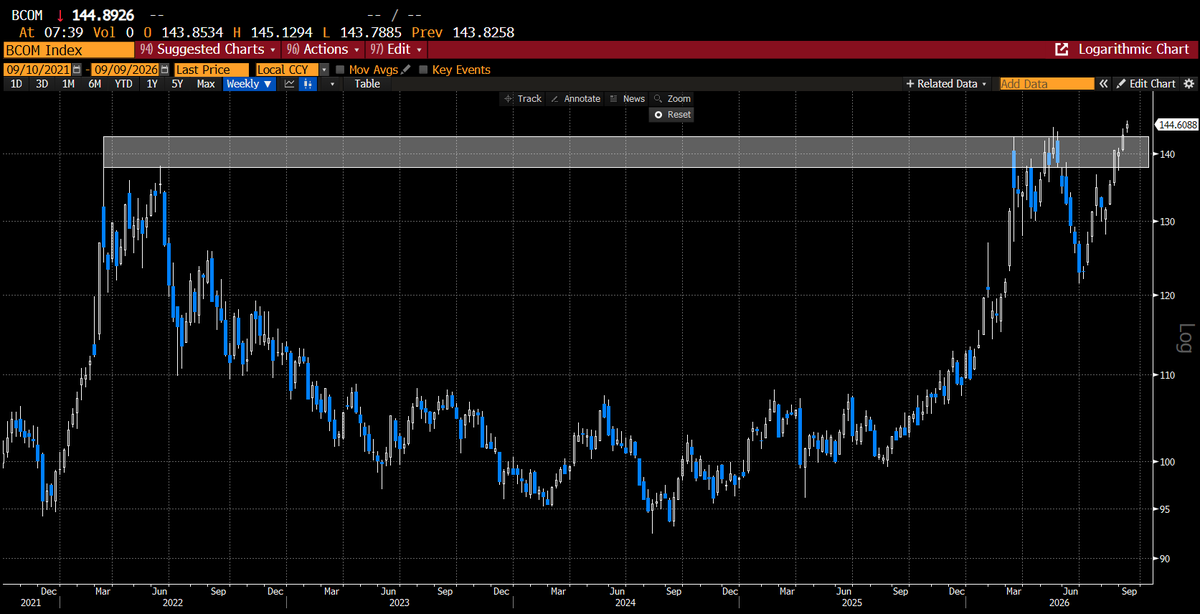
The Bloomberg Commodity Index, which is heavily weighted toward energy and metals, has broken out of a multi-year possible cup and handle formation this week.
While it is impossible to know in real time whether a commodity super-cycle is developing, some market participants may be asking whether current commodity trends resemble the characteristics historically associated with commodity super-cycles.
Here's why:
1. Is the strength broad-based?
-- Participation appears to have broadened beyond precious metals and livestock into industrial metals, energy, agriculture, and soft commodities.
2. Have prices remained elevated for years?
-- Gold broke multi-decade highs early in 2024, and this was around the same time the breakout occurred in livestock.
-- The precious metals rally then moved towards silver later in 2025, where it soared above its 1980 ceiling. The rotation then shifted to industrial metals, such as copper, palladium, and platinum late in 2025.
-- Then early this year, participants experienced a major breakout in crude and heating oil within the energy complex.
-- Energy prices have remained elevated for most of the past year.
-- Strength in agriculture then followed.
3. Is demand driven by structural forces rather than temporary shocks? Supply constraints?
-- AI infrastructure, data centers, electrification, and grid investment all require tremendous amounts of raw materials. As a result, technicians may be watching whether these themes continue to support demand for industrial commodities over time.
-- Copper continues to benefit from AI infrastructure, data centers, and grid investment.
-- Mines, energy projects, and refining capacity take years to build. Many commodities markets experienced underinvestment during the 2013-2020 commodity bear market.
-- Commodity spikes see in 2020 or 2021-2022 were temporary shocks due to Covid, supply chain disruptions, and the Russia/Ukraine geopolitical tensions.
-- While many of the Covid-era supply disruptions and geopolitical shocks have faded, commodity demand has remained surprisingly resilient. Technicians may be watching to see whether this strength represents a cyclical recovery or the early stages of a more structural shift.
4. Inflationary pressures?
-- Higher commodity prices are often the upstream source of inflation.
-- More persistent inflationary regimes often begin with real-world input costs, such as energy, metals, agricultural products, transportation, etc., which are the building blocks of economic activity.
-- Broad commodity inflation tends to be harder for central banks to ignore rather than isolated price shocks.
-- Interest rates have moved higher recently, with the 10-year yield rising ~18% over the past year.
5. Relative performance shifts?
-- A key hallmark of prior commodity cycles over the decades has been the relative outperformance of commodities to other financial assets.
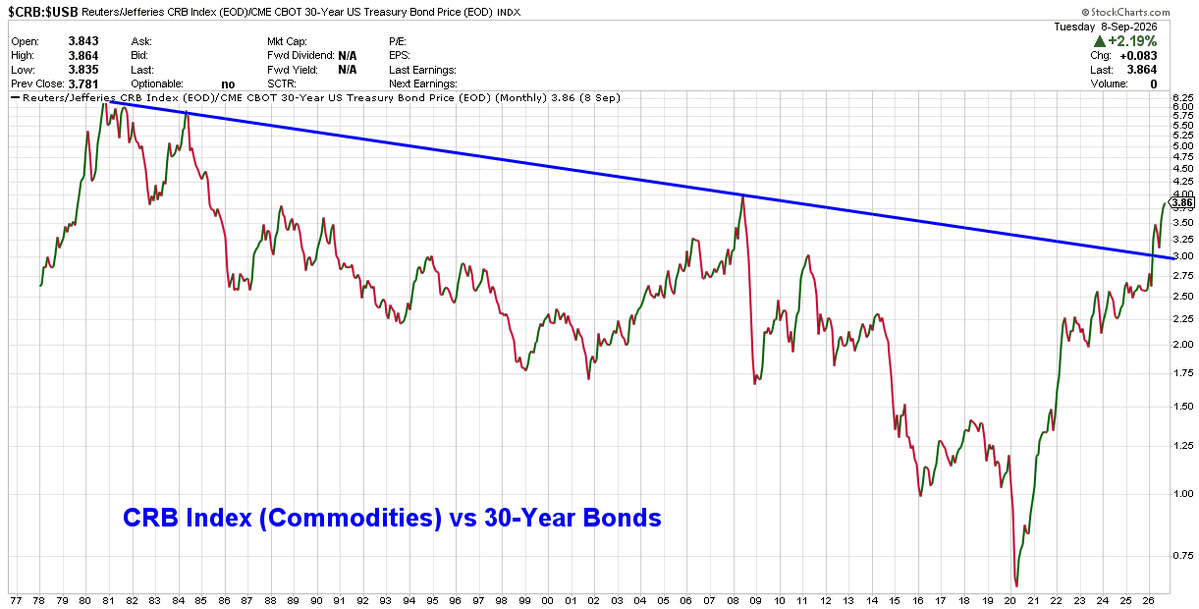
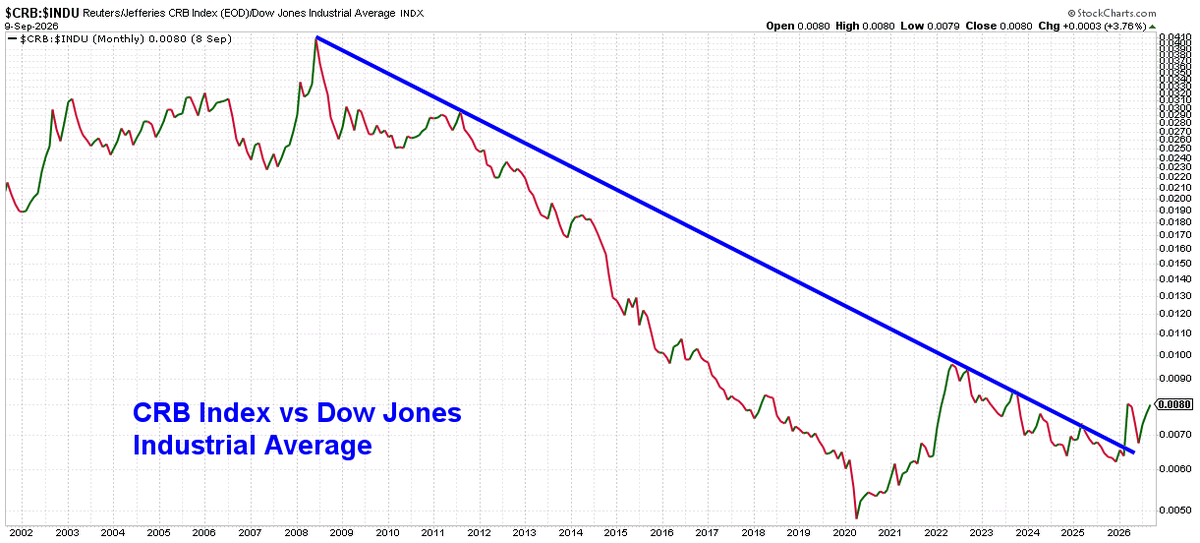
-- Using the $CRBIndex, another commodity-focused index -- notice how secular downtrends of both $Stocks and $Bonds have been broken relative to $Commodities
-- Commodities are pressing up on financial crisis highs relative to bonds.
-- The relative relationship between the $DJIA and $CRBIndex has improved materially and may be suggesting a potential change in the secular trend.
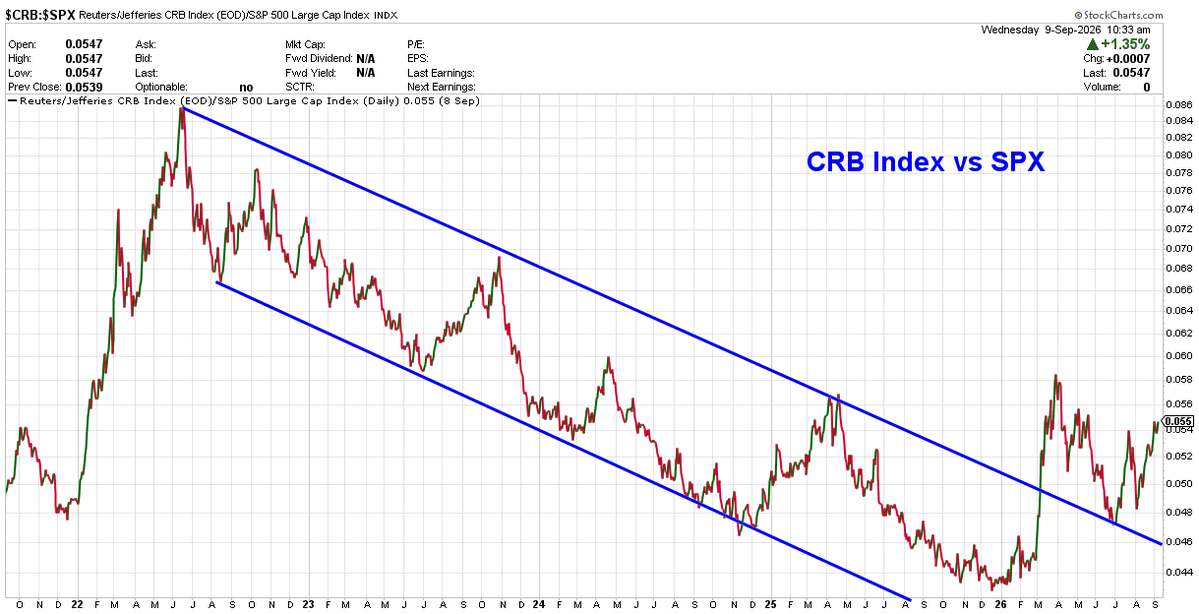
-- Even measuring the $SPX relative to $CRB, notice how a multi-year bearish channel was broken earlier this year. Now the relative relationship appears to be forming an inverse head & shoulders formation from 2024 highs.
Whether this ultimately proves to be a commodity super-cycle remains to be seen.
However, when evaluating the characteristics that have historically accompanied long periods of commodity leadership, the current backdrop appears to be checking several boxes: broad participation, sustained strength, potential structural demand drivers, supply constraints, inflationary pressures, and improving relative performance versus traditional financial assets.
Investors/traders should also remember that commodity markets rarely move in straight lines. Commodities are inherently volatile and have historically experienced both powerful advances and deep corrective phases throughout longer-term trends.
While current conditions may resemble elements of prior commodity cycles, past market behavior does not guarantee future results, and there is no assurance that current trends will persist.
*Schwab does not recommend the use of technical analysis as a sole means of investment research
*All names and market data shown below are for illustrative purposes only and are not a recommendation, offer to sell, or a solicitation of an offer to buy any security
*Chart sources: Bloomberg and https://t.co/Z8VY306nrP
$SOL $ETH $BTC
Cryptocurrencies are consolidating in increasingly tight ranges beneath key areas of resistance, creating setups that resemble potential bull flag formations.
Price is also approaching a confluence of resistance near the Anchored VWAPs from the yearly highs, a level many technicians may view as an important gauge of whether buyers are gaining or losing control.
With volatility continuing to compress, market participants may be watching to see how prices ultimately resolve from these consolidations. As always, breakouts and breakdowns remain possible, and technicians often look for additional confirmation before drawing conclusions about trend direction.
*Schwab does not recommend the use of technical analysis as a sole means of investment research
*All names and market data shown below are for illustrative purposes only and are not a recommendation, offer to sell, or a solicitation of an offer to buy any security
*Chart source: thinkorswim
$BrentCrude is testing resistance at the upper bounds of a multi-month symmetrical triangle.
The more times a trendline is touched, the market is increasingly showing how critical that level has become. Repeated tests can help technicians identify areas where supply and demand may be becoming concentrated.
Using Fibonacci analysis, some technicians may identify a potential area of resistance near $100, which represents a confluence of a prior gap, prior swing highs, and the 61.8% retracement level. Market participants may be watching to see whether price can sustain a move through that area, as an additional ceiling may emerge near prior highs around $120.
At the same time, $Brent appears to be encountering trendline resistance, which may keep attention on support levels as well. Technicians may view the lower bounds of the triangle and the 38.2% Fibonacci retracement near $89 as an area worth monitoring should the consolidation continue.
As with any technical pattern, multiple outcomes remain possible, and technicians often look for additional confirmation before drawing conclusions about a potential breakout or breakdown.
*Schwab does not recommend the use of technical analysis as a sole means of investment research
*All names and market data shown below are for illustrative purposes only and are not a recommendation, offer to sell, or a solicitation of an offer to buy any security
*Chart source: thinkorswim
My take away from Powell's last presser are:
- He is very obviously concerned about the threat to Fed independence from the current administration. He gave lame excuses otherwise as to why he was staying on, but the subtext was obvious.
- There is a bias shift taking place on the FOMC that Warsh won't be able to overcome. The committee is shifting toward considering hikes rather than cuts so as of this meeting it would be fair to say the bias has now left easing and is squarely neutral. Powell dropped clues that if Hormuz stays closed for much longer than hikes will be on the way.
- The Fed is concerned about stagflation. He made a purpose to multiple times mention the inflationary effects of rising oil and the tariffs. He also made a purpose of highlighting specifically multiple times that gas prices going up reduces available disposable income and as a result he said it WILL impact GDP.
Anyone calling this meeting/presser a "nothingburger" has no idea what they are talking about or aren't adept at understanding Fedspeak. This was a warning shot to Trump and Warsh that the committee will not be cutting any time soon and they will resist any attempts of outside entities to force cuts or anything else that threatens Fed independence. Rates are staying higher for longer.
Yep we are screwed because most of you have no idea what’s going on. The IEEPA tariffs were ruled unconstitutional, but Trump had several different types of tariffs implemented on Liberation Day, not just IEEPA. Additionally once IEEPA was struck down his administration found a workaround and just shoved them into a new tariffs category. The fact that you guys actually believe the propaganda is a big problem.
So a little history lesson for you all, the 1929 crash was not the start of the Great Depression, but it was a major cause of it. Herbert Hoover was essentially the Trump of a century ago, a businessman obsessed with the market and not exactly the sharpest tool in the shed. When the market crashed in 1929 one of the solutions pushed by Hoover to help the economy which was sliding into recession thanks to the crash were the Smoot-Hawley Tariffs which were actually one of the primary causes of the recession becoming a depression because it choked off trade. Any of this starting to sound familiar?
I thought the IRGC put Ghalibaf on house arrest and he was removed from his government positions last month during those "negotiations", now suddenly he's all over these ones running the show?
It's hilarious to see how many of you think this is sustainable for even a month. The cult behavior created by that failed game store really brought the dumbest people into this market.