Do you like puzzles? This is data from Breakthough Listen, specifically from HIP117463 at 2016-March-04 06:02:36 PM from the Green Bank Telescope with a center frequency of 1406.25 MHz. I recently processed it with https://t.co/yKqDGyGfjk, using a frequency resolution of ~5 MHz, with the Swap I/Q and Invert Channel Order options both disabled. I found the hydrogen line signals, but they blank out temporarily. And the narrow signals didn't blank out. Are all those narrow signals just receiver artifacts? But also, the way the large hydrogen line clusters go dark at the right and left channel edges seems odd. Was the channel order reported wrong and need to be inverted? Or do I/Q need to be swapped to spectrally flip each channel? Either of those would cause the two large clusters to be placed together as one larger cluster split across two adjacent channels. But doing so has consequences on the perceived received frequency, the number of distinct objects, the measured Doppler shift of those objects, and therefore their velocities relative to Earth.
@xai as you work toward advancing our collective understanding of the universe, it's critical that these types of radio astronomy data collection issues are ironed out.
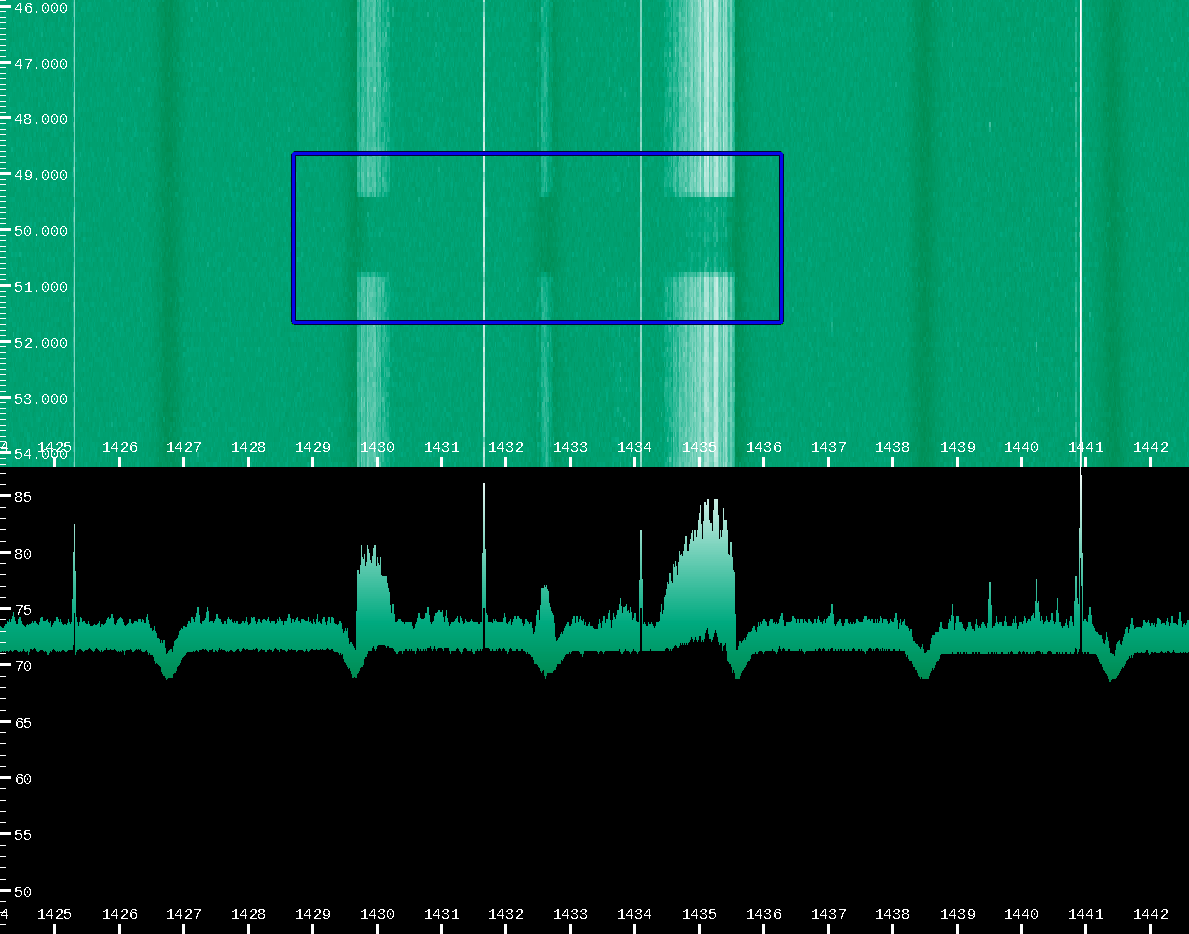
We might not have found ET technosignatures yet in Breakthrough Listen, but there are plenty of terrestrial ones to help us get a sense of what technosignatures can look and sound like. This one was observed November 3, 2017 by the Green Bank Telescope while looking in the general direction of W75S. @xAI if you're interested in understanding the universe, there's a wealth of data yet to be fully explored
Built a working system for distributed labeling of Breakthrough Listen-scale RF spectrograms + narrowband I/Q extraction. Solo founder, nights/weekends. Would love to talk to @xAI about integrating or acquiring it - aligns perfectly with understanding the universe. Open to the AI Tutor role too. DMs open. Check it out at https://t.co/yKqDGyGfjk
@YuriMilner want to gameify Breakthrough Listen? Think @Slooh for SETI and radio astronomy. Radwave scales to make big spectrograms fully interactive, so it could be the engine. https://t.co/0NT0VKT8Uz
@Slooh are you interested in expanding into radio astronomy? I created a method to serve the spectrograms interactively, and am looking for collaborators. You can get a sense of it here: https://t.co/0NT0VKT8Uz
We are very excited to announce that the GNU Radio Project will once again be part of Google's Summer of Code 2019! This is our 7th year participating in GSoC, and we're eager to hear from students that want to join.
https://t.co/96hdA44esY
We have released an updated version of the Android driver into open beta - you can sign up here: https://t.co/61AeNSirOs
This works with SDR Touch on the play store: https://t.co/uDYcScsEwy
@javierodom@Vecteezy Cool, I'll probably do that first before the arbitrary hop. The UI is easier for that, so should be quicker to implement. Thanks for all the feedback!
@javierodom@Android Would it be enough to tap the center frequency and have a transparent widget appear over there spectrum with the controls? I'd like to keep the main display as uncluttered as possible.