Goldman Sachs just dropped a wild projection on SpaceX's AI potential.
They think SpaceX's AI revenue could balloon 100x by 2030.
That's not just a small tweak—it's a complete shift in the story. 🔥
Everyone still sees SpaceX as just a rocket company.
But that's off.
SpaceX is turning into:
satellites
Starlink
space infrastructure
AI data networks
global reach
future computing power
If AI needs data, computing, and worldwide networks, then SpaceX could become a giant in the AI game.
That's why people are glued to the SpaceX / $TSLA / $SPCX story.
Rockets were just the start.
The real money might be in AI infrastructure. 🚀
$PLTR's last couple of days aren't just a normal dip anymore.
It shot up from about $132 to nearly $163, showing crazy short-term strength.
But after that big rally, it quickly dropped back to around $140—profit-taking is clearly kicking in at higher prices. 📉
Now, the key level isn't $163 or $140.
The real make-or-break zone is $136–$139. 🎯
This area will tell us if the run was just hype or if the bullish trend can keep going.
If $136–$139 holds, buyers are still in the game and the market still believes in $PLTR's AI software story. Another bounce is possible.
But if it breaks, the short-term setup gets weak. Folks who bought high might keep selling, and the stock could find lower support. Market cap pressure might grow too.
This pullback isn't just about $PLTR.
The whole U.S. market is under pressure:
$SPX is weakening.
$NDX / $QQQ are pulling back.
AI growth stocks are cooling down.
High-valuation software names are getting repriced.
Short-term money is leaving high-beta stocks.
So this $PLTR dip is really about two things:
First, it moved too fast and needs to digest.
Second, the broader market and tech vibe are cooling.
But long term, I still don't see $PLTR as just another software company.
Its real value comes from:
AI data analytics.
Government and defense systems.
Enterprise AI platforms.
Large-scale institutional decisions.
Sticky customer ties.
In the AI era, controlling data means controlling decisions.
That's the long-term upside story behind $PLTR. 🚀
My take is simple:
Don't chase blindly short term.
Watch $136–$139 closely.
If support holds, the rebound chance is still there.
If support breaks, short-term risk keeps increasing.
$PLTR's long-term story is solid, but short-term price action has to respect technical support and market pressure.
⚠️ This is market analysis only, not financial advice. Please do your own research.
@josephcurl Rallies like that always make me wonder if it's just algos chasing momentum before the rug gets pulled. Curious to see if $427 holds or if we test lower.
🚨 $MSFT is hitting a key technical spot right now.
In the last two trading days, Microsoft jumped sharply from around $412 to almost $466.
That was a big rally.
But after that fast surge, the stock quickly dropped and is now hovering near $427. 📉
This shows one thing clearly:
The stock is still strong in the long run, but short-term folks are taking profits.
The key support level I'm keeping an eye on is $419–$423. 🎯
That's where buyers need to step up.
If $MSFT holds this area, the bullish setup stays alive and we could see another bounce.
But if it breaks, the market might start betting on bigger downside, especially with the broader market already shaky.
Right now, it's not just about Microsoft.
The whole U.S. market is cooling off.
$SPX is under pressure.
$NDX is pulling back.
$QQQ is losing steam.
Mega-cap tech isn't moving straight up anymore.
The reason is simple:
After a strong run in AI and big tech, the market needs time to digest valuations, earnings expectations, and risk appetite.
For $MSFT, the long-term story remains strong.
Azure cloud growth.
Enterprise AI.
Copilot.
Office ecosystem.
Windows.
LinkedIn.
Enterprise software.
These aren't short-term hype plays. They're real business engines driving Microsoft's long-term growth. 🚀
But even great companies pull back.
That's why I'm not blindly buying $MSFT here.
My plan is straightforward:
Watch $419–$423.
Watch $SPX, $NDX, and $QQQ.
Watch if buyers defend support.
Watch for volume to come back.
If support holds, this could be a solid pullback opportunity.
If it breaks, short-term risk goes up.
Long term, I'm still bullish on $MSFT.
Short term, patience beats emotion.
⚠️ This is market analysis only, not financial advice. Please do your own research.
@saffronroseacts 15-min charts are wild for catching those intraday shifts. 1038 to 1089 is a decent sprint, but holding near 1079 doesn't always mean buyers are locked in—could just be people waiting to see if it breaks or fades.
$MU is still trading like one of the strongest names in the AI memory space. 🚨📊
On the 15-minute chart, $MU moved up from about 1,038 and ran all the way to 1,089.
Now it's hovering around 1,079, which tells me buyers are still in the game, but the stock is in a high-level consolidation zone.
This chart isn't weak.
It's strong, but it needs support confirmation.
The first level I'm watching is 1,069–1,070.
If $MU pulls back and holds that area, the short-term bullish setup stays solid.
Key support is 1,057–1,058.
As long as $MU stays above that, the trend remains intact.
If $MU can reclaim 1,089–1,090, the market might start eyeing the next psychological level around 1,100.
But this is bigger than just Micron.
When $MU moves, the whole AI memory and data center supply chain gets attention:
$NVDA — AI GPUs need HBM
$AMD — AI accelerators
$AVGO — custom AI chips + networking
$MRVL — AI networking + data movement
$TSM — advanced chip manufacturing
$WDC — NAND and storage
$STX — data storage demand
$DELL — AI servers
$SMCI — AI server infrastructure
$AMAT $LRCX $KLAC — semiconductor equipment
$SMH $SOXX — semiconductor ETFs
My take is simple:
AI isn't just about GPUs anymore.
AI needs memory.
AI needs HBM.
AI needs storage.
AI needs servers.
AI needs full data center infrastructure.
That's why $MU matters.
Strong chart.
Strong AI memory story.
Strong semiconductor read-through.
But after a big move, entry price still matters.
I'm looking for support confirmation, not emotional chasing. 📊🔥
Not financial advice.
@flakeybrunette Bounce was solid but sitting right under that 546 level feels like it could go either way. Waiting for a clean break before I add more.
$AMD is starting to feel like a momentum recovery trade again. 🚨📊
On the 15-minute chart, AMD bounced hard from around 524 and ran up to 546.
That shows buyers are still in the game.
But now it's sitting near 542, close to the recent high, so I'm not chasing too aggressively.
First level I'm watching is 538.
If $AMD dips and holds 538, the short-term bullish setup looks solid.
Key support is 532–533.
As long as $AMD stays above that range, bulls are in charge.
If it can break above 546–547 with strength, momentum might keep going.
But this isn't only about AMD.
When $AMD moves, the whole AI chip and data center ecosystem pays attention:
$NVDA — AI GPU leader
$TSM — advanced chip making
$MU — AI memory and HBM
$AVGO — custom AI chips + networking
$MRVL — AI networking + custom silicon
$ARM — chip architecture
$DELL — AI servers
$SMCI — AI server infrastructure
$ASML $AMAT $LRCX $KLAC — semiconductor equipment
$SMH $SOXX — semiconductor ETFs
My take is simple:
AI demand won't rely on just one company.
$NVDA is still on top, but hyperscalers need more supply, more competition, and better data center options.
That's where $AMD fits in.
EPYC CPUs.
Instinct AI GPUs.
Data center acceleration.
AI infrastructure demand.
The chart looks good.
Buyers are active.
The AI chip story isn't dead.
But after a quick move, entry price still matters.
I'd rather wait for support confirmation than buy near the high. 📊🔥
Not financial advice.
$ASML is now in a high-level pullback test, not a broken chart. 🚨📊
The 15-minute chart shows a strong move from the 1,588 area all the way to 1,742.7.
That was a powerful semiconductor equipment momentum move.
But after touching the high, $ASML pulled back to around 1,726, which means buyers are now being tested.
The key level I am watching first is 1,722–1,723.
If $ASML holds this area, the short-term structure still looks healthy.
The real key support is 1,710–1,711.
As long as $ASML stays above that zone, the broader short-term bullish structure remains intact.
If price can reclaim 1,732–1,735, momentum starts to recover again.
But the bigger story is not only ASML.
When $ASML moves, the market usually starts watching the entire semiconductor equipment and AI chip supply chain:
$AMAT — semiconductor equipment
$LRCX — etch and deposition tools
$KLAC — inspection and process control
$TSM — advanced chip manufacturing
$INTC — foundry expansion
$NVDA — AI GPU demand
$AMD — AI accelerators
$AVGO — custom AI chips and networking
$MRVL — AI networking and custom silicon
$MU — AI memory and HBM
$SMH $SOXX — semiconductor ETFs
My view is simple:
AI does not stop at GPUs.
AI demand eventually flows into advanced nodes, EUV tools, fabs, wafers, inspection, memory, networking, and the entire semiconductor capex cycle.
That is why $ASML matters.
It is one of the biggest bottleneck companies in advanced chip manufacturing.
The chart is still constructive.
The pullback is testing support.
The semiconductor equipment theme is still alive.
But after a strong move, entry price matters.
I want confirmation, not emotional chasing. 📊🔥
Not financial advice.
$XOM is flashing a clean energy breakout signal today. 🚨📊
On the 15-minute chart, Exxon Mobil broke out of the 148–150 range and jumped straight to 153.
This shows buyers are shifting back into energy.
This isn't weak price movement.
It's a clear short-term bullish breakout.
But after a quick surge, I'm not jumping in at the peak.
I'm watching 152.1 first.
If $XOM dips and holds near 152.1, it means buyers are still backing the breakout.
Key support is 150.7–150.8.
As long as $XOM stays above that, the short-term bullish setup holds.
But it's not just about Exxon.
When $XOM moves, the whole energy chain gets attention:
$CVX — big integrated oil
$COP — upstream oil and gas
$OXY — oil production with Berkshire ties
$EOG — shale oil leader
$FANG — Permian Basin focus
$SLB — oilfield services
$HAL — drilling and services
$BKR — energy tech and LNG services
$LNG — natural gas export play
$XLE — energy sector ETF
$XOP — oil & gas exploration ETF
My take is straightforward:
If energy stocks break out while tech stays strong, the market could be broadening past AI.
That's significant.
$XOM isn't just an oil stock.
It's a cash flow, dividend, energy security, and inflation hedge asset.
Strong chart.
Clear energy rotation signal.
Solid sector read-through.
But entry price still counts.
I'd rather wait for support confirmation than chase a fast move. 🚀📊
Not financial advice.
$AMAT is looking really strong in the semiconductor equipment space right now. 🚨📊
On the 15-minute chart, Applied Materials broke out of that 448–454 range, reclaimed the 463–464 zone, and ran all the way to 491.
That's a solid momentum move.
Right now, $AMAT is hanging near the highs around 489–490. Buyers are still in charge, but after a run like this, I'm not jumping in at the top.
First level I'm watching is 480.
If $AMAT dips back and holds around 480, it shows buyers are still backing the breakout.
Key support to watch is 473.
As long as $AMAT stays above 473, the short-term bullish setup stays intact.
But it's not just about this one stock.
When $AMAT moves like this, people start paying attention to the whole semiconductor equipment and AI chip supply chain.
Stocks to keep an eye on:
$ASML — EUV lithography
$LRCX — etch and deposition tools
$KLAC — inspection and process control
$TSM — advanced chip manufacturing
$INTC — foundry expansion
$NVDA — AI GPU demand
$AMD — AI accelerators
$AVGO — custom AI chips and networking
$MRVL — AI networking and custom silicon
$MU — AI memory and HBM
$SMH $SOXX — semiconductor ETFs
My take is simple:
AI chip demand isn't just about GPUs.
It flows into fabs, tools, wafers, advanced processes, memory, networking, and the whole semiconductor capex cycle.
That's why $AMAT matters.
Strong chart.
Strong sector rotation.
Strong AI infrastructure read-through.
But after a big move, entry price still matters.
I'd rather wait for a clean pullback near support than chase strength at the top. 🚀📊
Not financial advice.
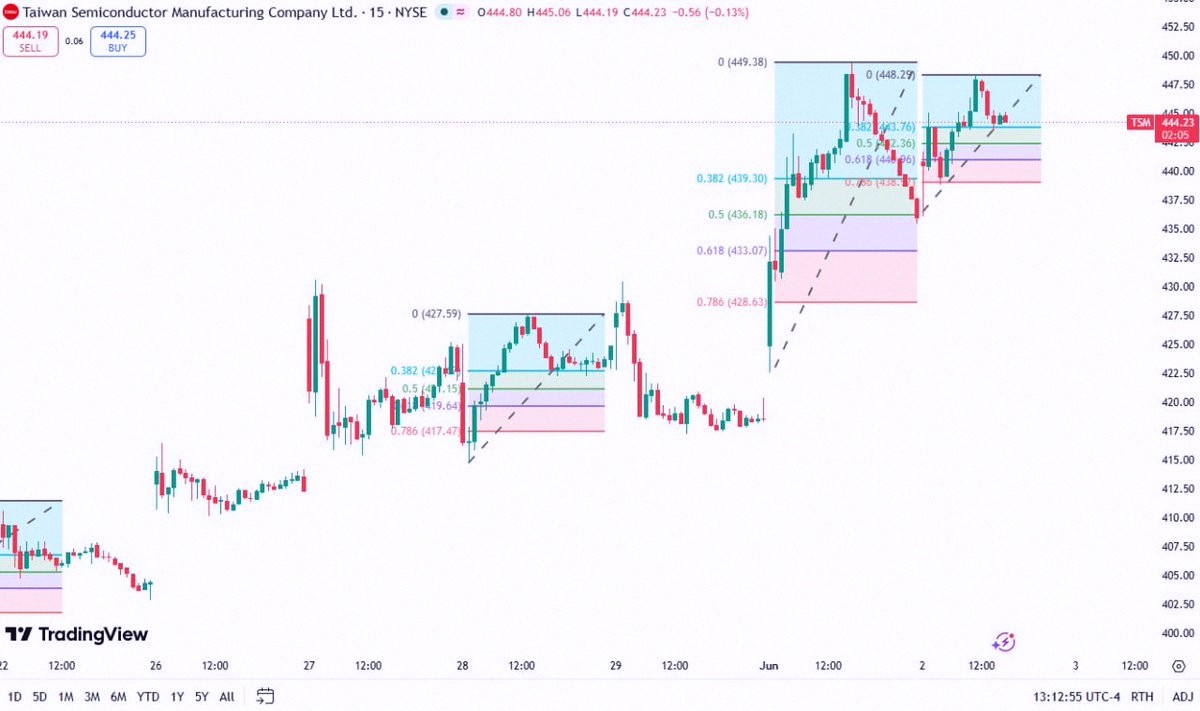
$TSM is flashing a major signal for the AI chip world. 🚨📊
On the 15-minute chart, TSMC shot up from around 417, climbing all the way to 449.
Then it pulled back, found support, and is now sitting near 444–445.
But this doesn't feel like a true breakdown.
It looks more like a healthy retest after a big breakout.
The levels I'm eyeing:
Support: $443.7
If $TSM stays above this, short-term upward movement is still intact.
Key support: $440.9
Below that, recovery starts to look shaky.
The bigger takeaway is this:
$TSM isn't just another stock.
It's the factory behind the entire AI chip cycle.
When $TSM makes a move, it ripples through the whole supply chain:
$NVDA — AI GPUs
$AMD — AI accelerators
$AVGO — custom AI chips + networking
$MRVL — AI networking + custom silicon
$AAPL — Apple Silicon
$QCOM — mobile + edge AI chips
$ASML — EUV lithography
$AMAT — semiconductor equipment
$LRCX — etch and deposition tools
$KLAC — inspection and process control
$SMH $SOXX — chip ETFs
My take is just this:
If $TSM holds support, it says AI chip demand is still solid.
This isn't just about TSMC.
It's a peek into the whole AI chip food chain. 🚀📊
Not financial advice.
@MissBehave2121 Yeah, the run from 300 to 421 was impressive but I'm watching to see if it holds above 400 or starts slipping back. Feels like it needs a breather.