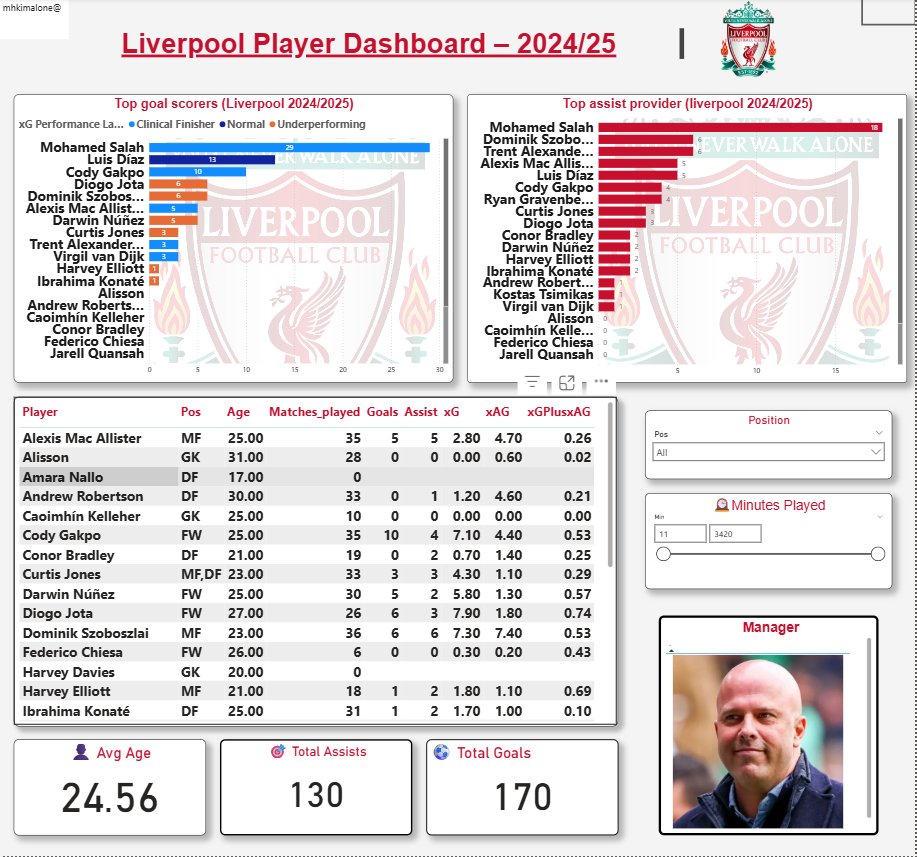
🚨 Built a multi-page Power BI dashboard tracking Liverpool FC’s 2024/25 player performance.
Includes stats on:
- Passing
- Shooting
- Defensive work
- Player profiles
See what it does 👇
#PowerBI#FootballAnalytics
Wednesday Tip 💡 (Power BI / Power Query):
Want to transform data without writing formulas?
Use Column From Examples in Power Query.
Just type the result → Power Query writes the formula for you.
Fast. Easy. Powerful. 🚀
#PowerBI#PowerQuery#DataAnalytics
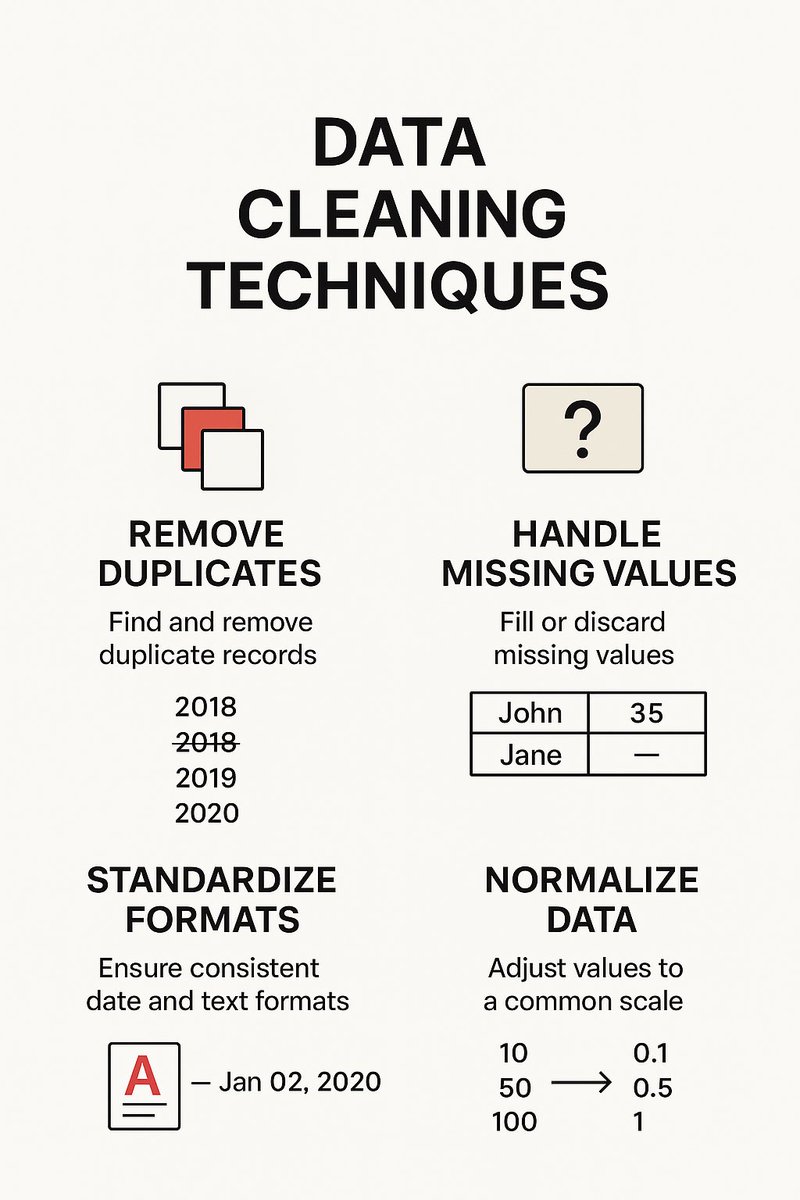
Before diving into insights, make sure your dataset is accurate, consistent, and ready for exploration.
Remove duplicates ✅
Handle missing values 🕳️
Standardize formats 📅
Normalize data 📊
Clean data = Reliable insights. 🚀
#DataAnalysis#DataCleaning#PowerBI#SQL#Python
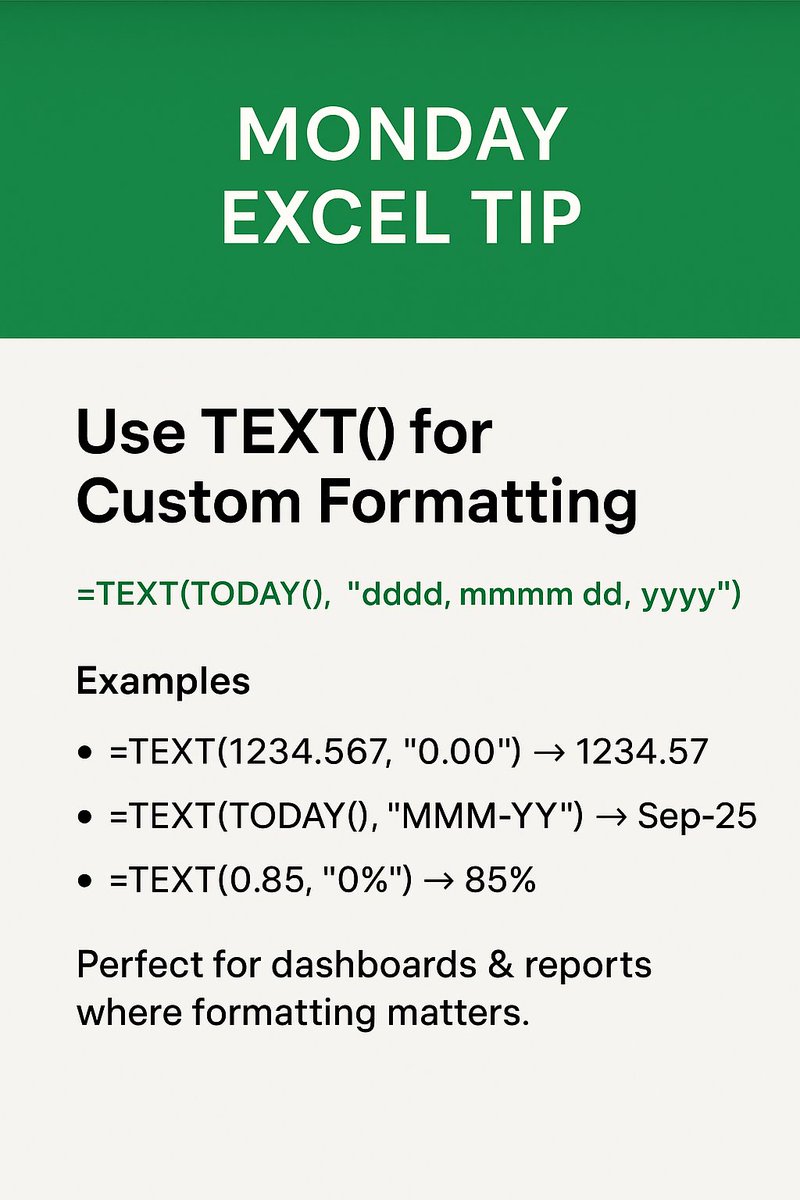
Monday Excel Tip: Use TEXT() for Custom Formatting
Instead of manually formatting numbers, use the TEXT() function to display values exactly how you want.
Perfect for dashboards & reports where formatting matters 🎯
#ExcelTips#DataAnalytics#ExcelFormula
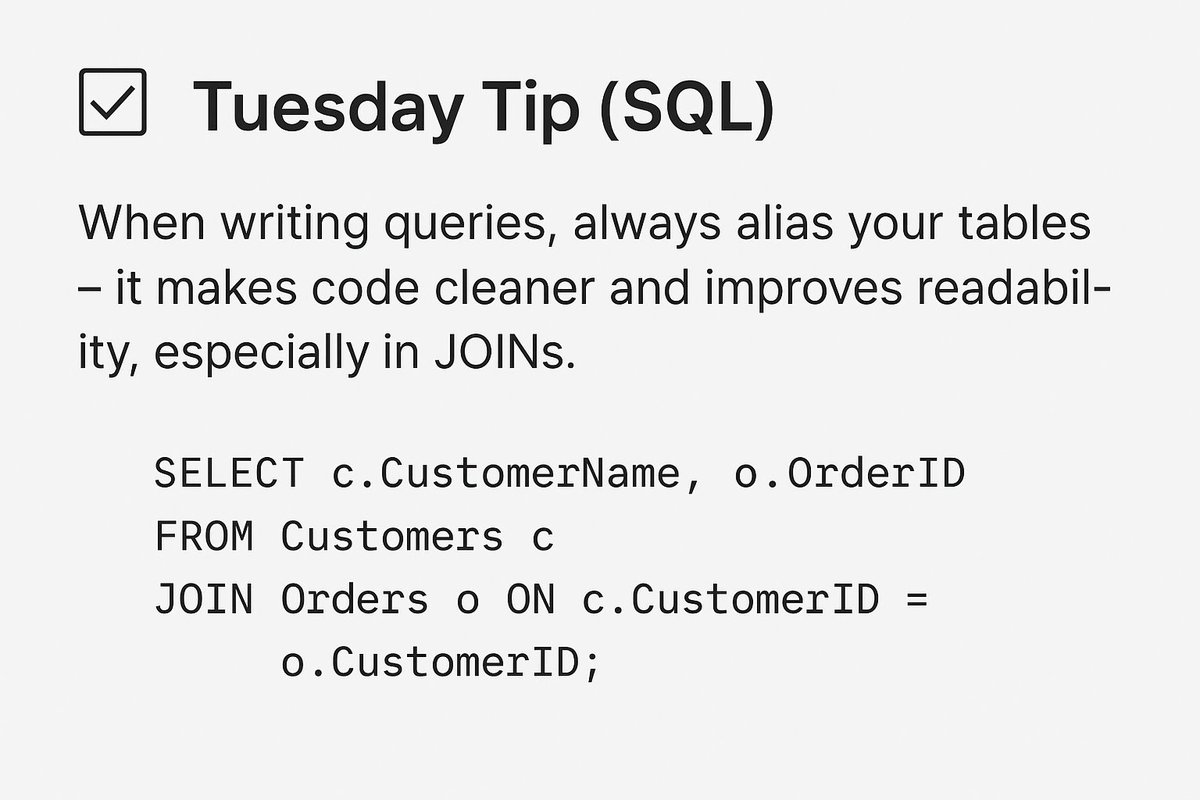
💡 Tuesday Tip (SQL)
When writing queries, always alias your tables – it makes code cleaner and improves readability, especially in JOINs.
Cleaner than writing full table names everytime!!
Example:
Tuesday Tip 💡:
Want to turn numbers into meaningful insights?
Use CASE WHEN to categorize your data.
📊 Example: Classify sales into Top Performer, Average, and Needs Improvement.
#SQL#DataAnalytics#SQLTips#DataScience
In what order did you learn?
1. SQL
2. Power BI
3. Tableau
4. Excel
5. python
6. R
7. Power Platform
Mine:
1. Python
2. Excel
3. Power BI
4. SQL
5. Power Platform
Monday Power BI Tip 💡:
Want your dashboards to look clean and professional?
Use consistent padding, alignment, and font sizes.
✅ Snap to Grid
✅ Align visuals
✅ Group elements
Your layout = your first impression. Make it count!
#PowerBI#DashboardDesign#UX
Skipped the usual CSVs and SQL — went straight to a live weather API 🌦️
Tracked real-time conditions across Nigerian cities.
As someone who dreads the rainy season, this project was oddly satisfying ☔✅
👉 Interact with the report here: https://t.co/Y4A8HJabui
💡 Why use INDEX + MATCH?
✅ Works left or right (unlike VLOOKUP)
✅ More flexible & faster in large datasets
✅ Easier to update when columns shift
Perfect for dynamic dashboards & cleaner formulas!
#ExcelTips#DataAnalytics#ExcelFormula
Friday Excel tips:
Still using VLOOKUP for everything? Time to upgrade 🔄
INDEX + MATCH is more powerful and doesn’t break when columns move.
💡 Why use INDEX + MATCH?
#ExcelTips#DataAnalytics#ExcelFormula#FridayTips
🚨 Built a multi-page Power BI dashboard tracking Liverpool FC’s 2024/25 player performance.
Includes stats on:
- Passing
- Shooting
- Defensive work
- Player profiles
See what it does 👇
#PowerBI#FootballAnalytics
🚨 Built a multi-page Power BI dashboard tracking Liverpool FC’s 2024/25 player performance.
Includes stats on:
- Passing
- Shooting
- Defensive work
- Player profiles
See what it does 👇
#PowerBI#FootballAnalytics
🚨 Built a multi-page Power BI dashboard tracking Liverpool FC’s 2024/25 player performance.
Includes stats on:
- Passing
- Shooting
- Defensive work
- Player profiles
See what it does 👇
#PowerBI#FootballAnalytics
💡 Some insights I discovered:
Mo Salah leads not only in goals, but progressive passing
Van Dijk & Konaté top in pass accuracy + clearances
Some midfielders outperform expected assists (xAG)
Real impact goes deeper than just goals.