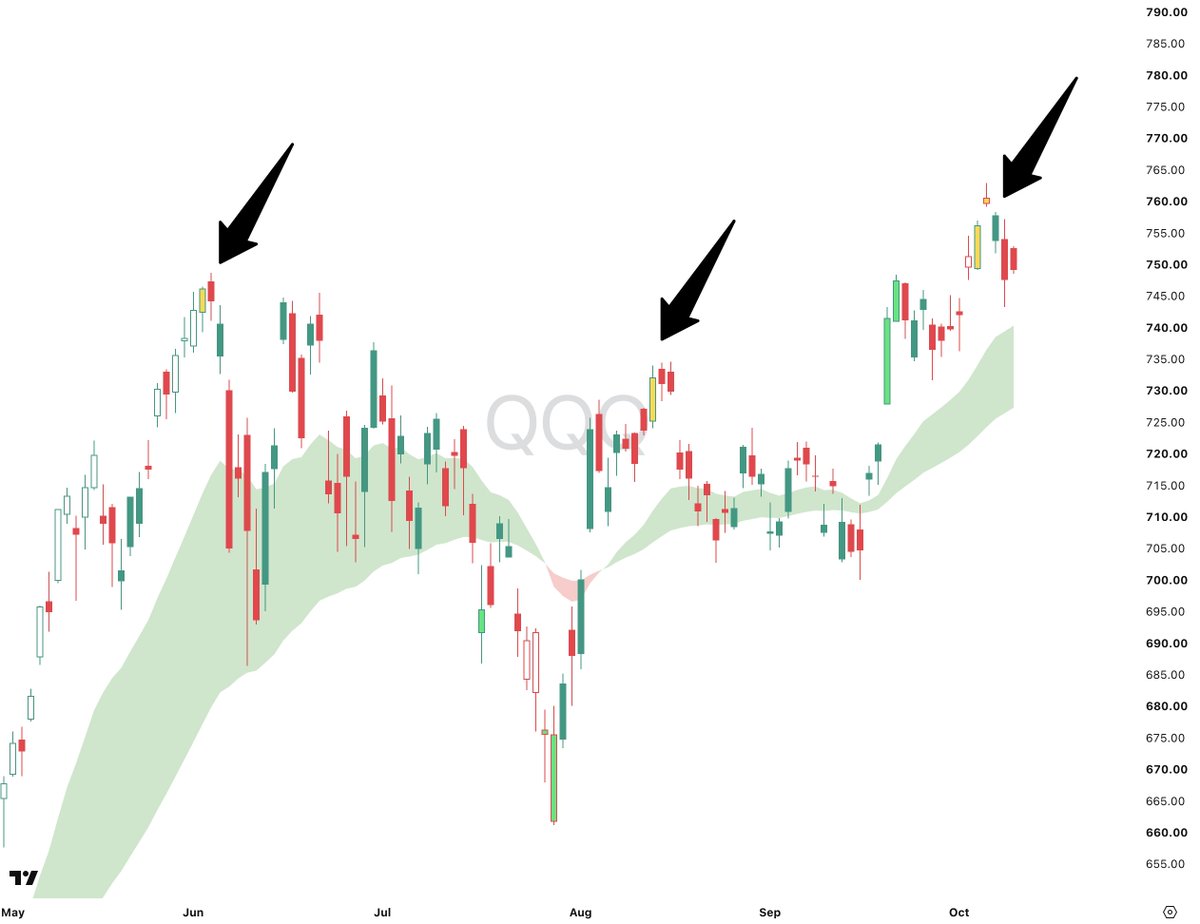
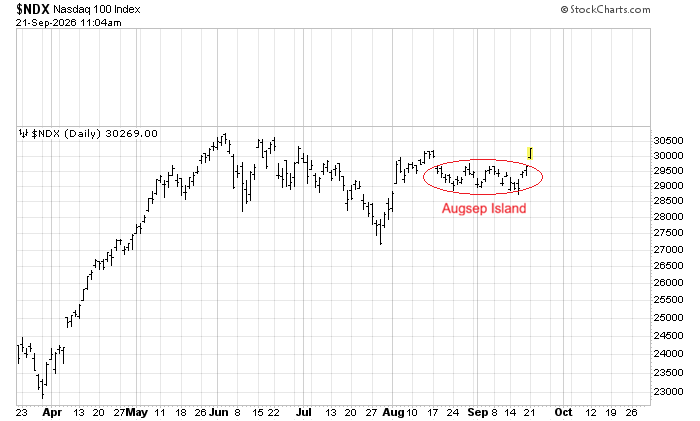
These yellow low volume breakout candles are amazing for predicting short term $SPY, $IWM and $QQQ tops.
The indicator and TradingView Pine Script is available to all subscribers.
🇺🇸 S&P 500
The US Equity Risk Indicator is flashing red, warning that the S&P 500 may be running hot. History shows that once this metric hits extreme levels, significant equity drawdowns often follow
👉 https://t.co/yIk7SZYp6p
h/t @bcaresearch#spx#stocks#equity $spx
$SPY can easily crash 5%-10% in September.
4 years ago, $SPY crashed -9.62% for midterm elections.
Be patient, this 1 strategy will 10x your portfolio:
Im about to blow your minds showing you the formula of the Gann Square of 9 using the S&P 500 ( $SPX ):
The S&P 500 has followed the Gann Square of 9 logarithmic spiral almost perfectly since the 1929 crash low of $4.40.
Every major bull run, every major top, every major crash — mapped by pure mathematics.
Here's what 95 years of market history looks like through Gann's lens 🧵
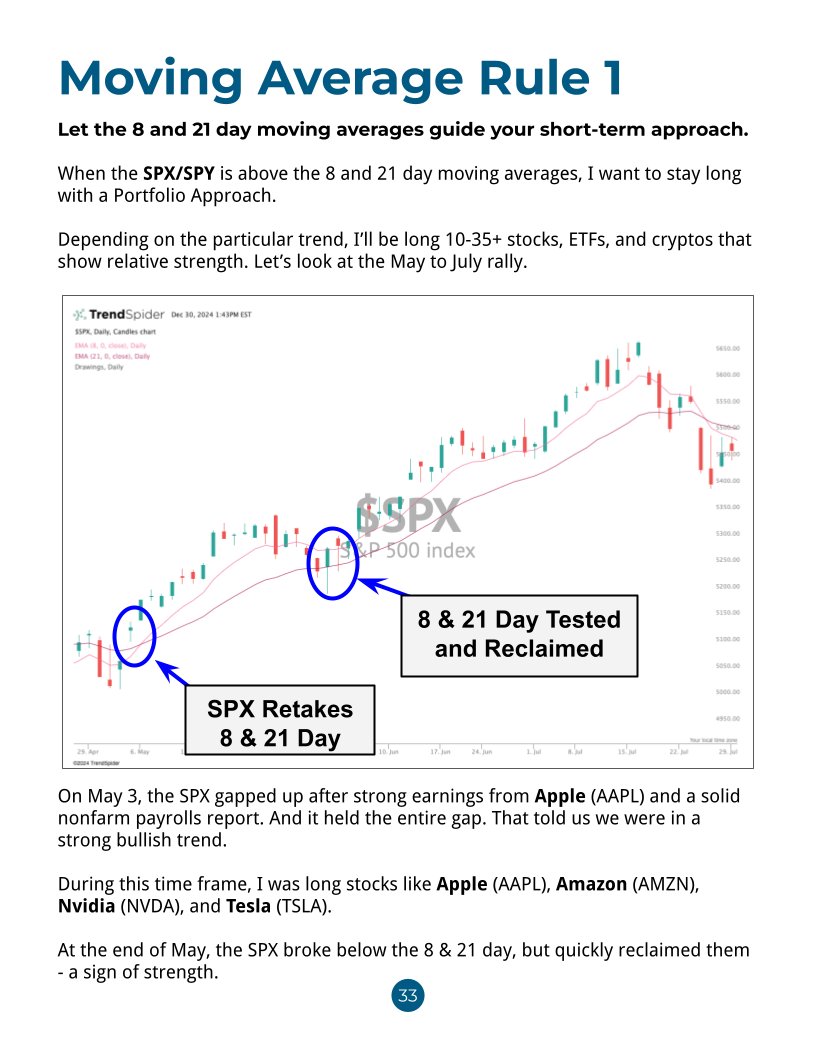
3 Moving Average Rules for Active Traders
#1) Let the 8 and 21 day moving averages guide your short-term approach.
When the SPX/SPY is above the 8 and 21 day moving averages, I want to stay long with a Portfolio Approach.
Depending on the particular trend, I’ll be long 10-35+ stocks, ETFs, and cryptos that show relative strength.
#2) Don’t fight stocks trending above the 8 & 21 day moving averages. Ride them!
Want to go broke really fast? Bet against a stock trending above the 8 & 21 day moving averages.
#3) When the SPX breaks the 8 & 21 day, Get Tactical.
That means I start selling longs, starting with names showing relative weakness, and anything I’m not completely bullish on.
Learn the system here: https://t.co/6Va8gzmwjx
A new traders' manual on Shiller's PE was added to the trading tools.
It covers the history of an indicator, does it predict a crash, every episode above 30 and much more.
Link: https://t.co/HAKj6hHhue
Are you prepared for where $SPX might be headed?
- $SPX is completing a 100-year-long super-cycle degree (III) bull market with a wedge.
- A break of the wedge will signal a start of wave (IV), which may last about 15 years.
- The first stop should be a cycle-degree wave a, which will likely target about 3500.
- After a multi-year bounce in a cycle-degree wave b, $SPX should decline in c of (IV) toward the low 1000s, i.e., the range of IV (the fourth wave of one lesser degree).
- After that, $SPX should embark on a massive super-cycle degree wave (V), which may last about 50 years.
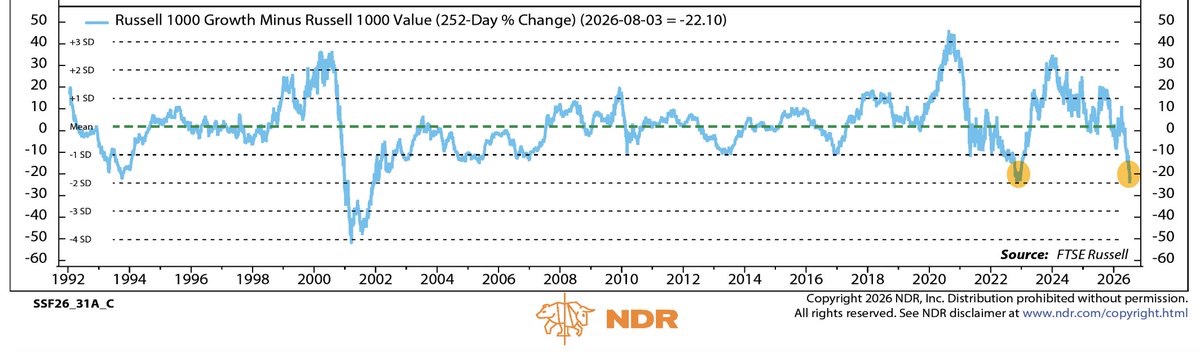
If you think rally cant last..(date)
As of Aug 3rd, on a Y/Y basis, Growth is about 2 standard deviations oversold, similar to where it was in Nov 2022
This was a tremendous long-term buying opportunity in 2022, Id be of the opinion a similar buying opportunity has begun, aside from the 4-day rally.
$SPX $SPY $QQQ $IVW $IVE $NDX $IWM $XLK $XLE $MAGS $SMH $SOXX $DIA $COMPQ
This might be one of my most important takes on the market right now:
The $SPY just printed a record and it is CHEAPER than it was a year ago. Both are true at the same time.
Same almost goes for $QQQ.
The forward P/E sits around 20. A year ago it spent stretches above 22. The index went up and the multiple came down.
That only happens for one reason. Earnings grew faster than price.
Q2 S&P earnings growth is tracking near 47% year over year. When the E in P/E runs that hard, the index can hit new highs and get less expensive on the way.
Now add breadth. Roughly 70% of S&P names are above their 200-day moving average, up from the low 40s last spring. This is not five stocks dragging an index. More of the market is participating than at the last set of highs.
Here is the part that matters for how you position.
“The market is at a record so it must be expensive and about to break” is the lazy read.
The data says records plus a falling multiple plus widening breadth is what a durable leg looks like, not a blowoff top.
That does not mean no pullback. It means the setup underneath the number is healthier than the number alone suggests. The people selling purely because it is “high” are selling strength, not froth.
-BP
Not financial advice.
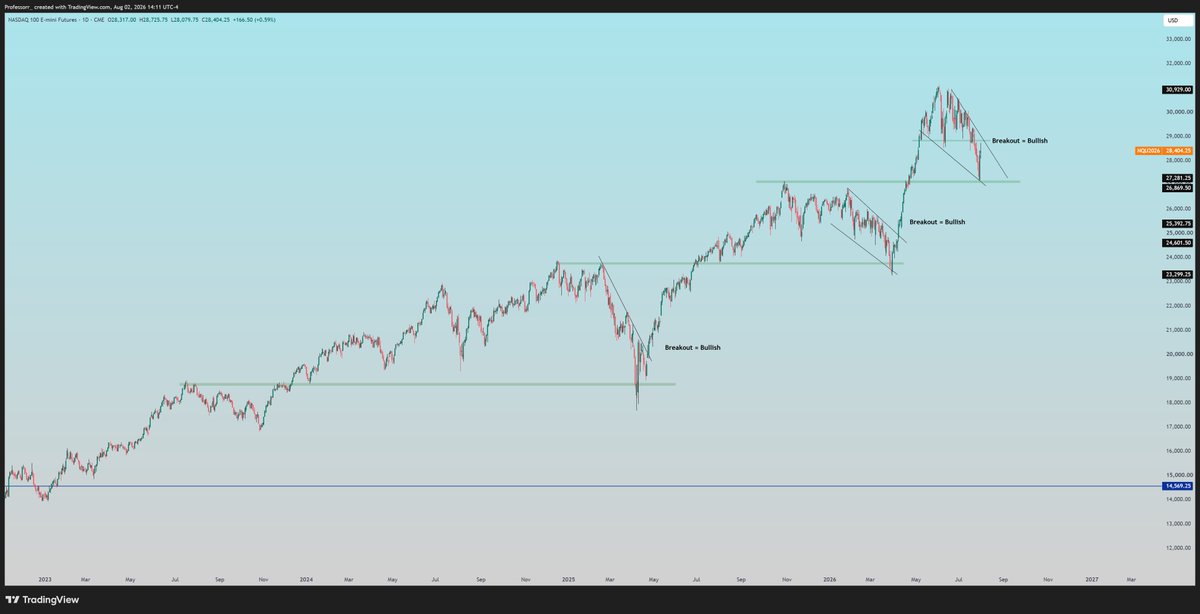
Let me share the one chart that will keep you on the right side of any market.
1. Let price reach a strong support
2. Draw a downtrend line
3. And get involved when price clears the DTL
You've gotta be comfortable to miss out on the exact bottom. The price of being right is usually higher
$QQQ $SPX $SPY
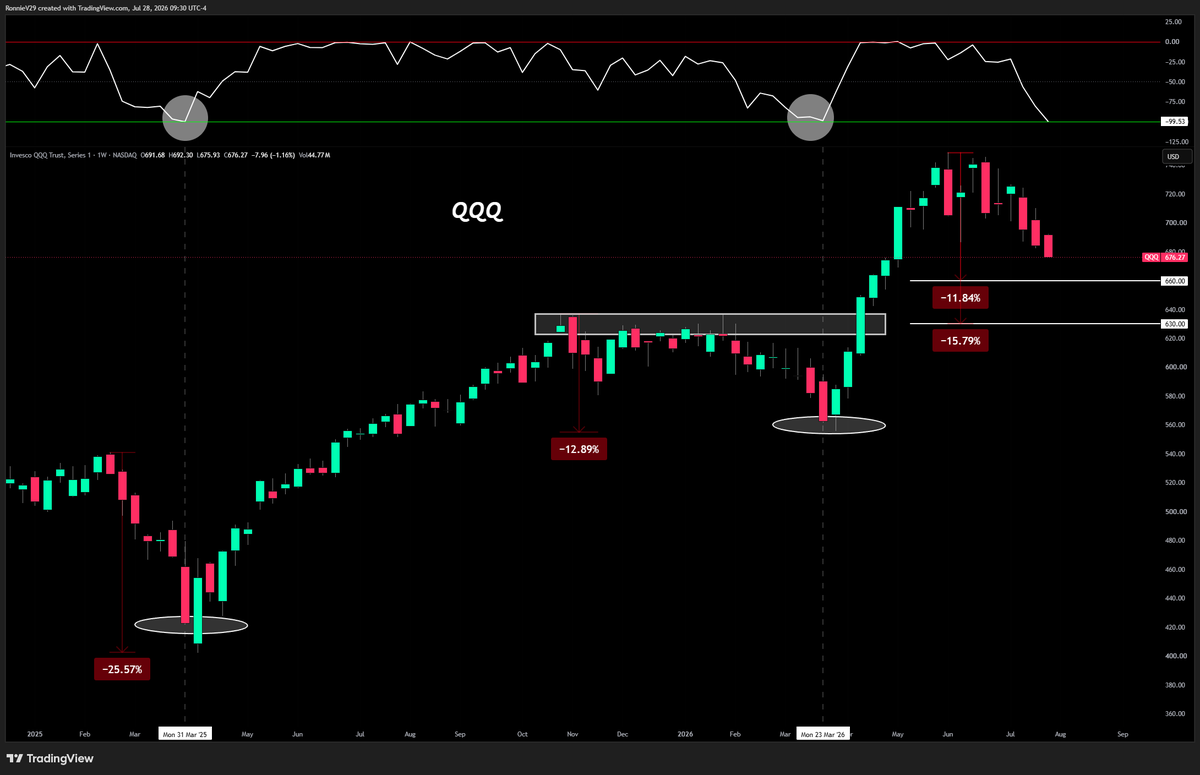
Flush then Bottom on $QQQ within 2 weeks.
Historically, when the W%R gets to the green barrier we bottom within two weeks on the weekly charts.
As long as this isn't the start of a bear market.
Level 1 Bottom: $660
Level 2 Bottom: $630
W%R doesn't close until end of week.
$QQQ Nothing more powerful and magnetizing for price than the 20-WMA
Of the 21 times this key WMA has been touched in last decade, it has only broken below and stayed below for greater than three weeks on 3 occasions = 3/21
Avg 1.5 touches annually.
1 touch from above in 2026
$NDX $COMPQ $SPY $SPX
The simple rule of thumb.
Trend up VS Trend down
When the index's 21 EMA crosses above the 50 SMA on the daily - you add exposure.
When the index's 21 EMA crosses below the 50 SMA on the daily - you reduce exposure.
That's it.
No panic selling. No FOMO buying. No guessing.
Complication resolved for everyone.
If you follow this- you will always be happy with your portfolio returns.
A MUST have copy for everyone.
The historical roadmap of market panic.
Every time a major macro headline breaks, retail investors panic and VIX spikes. But if you look at the history of these volatility spikes, they are almost always the absolute best asymmetric buying opportunities of a cycle.
When fear takes over, my playbook is simple:
VIX at 30: You buy.
VIX at 50: You double down.
VIX at 80: You leverage whatever you can.
Headlines will tell you the world is ending, but the data says you buy the blood.
This is all you need to time the stock market. Save this. Screenshot it. You will need it.
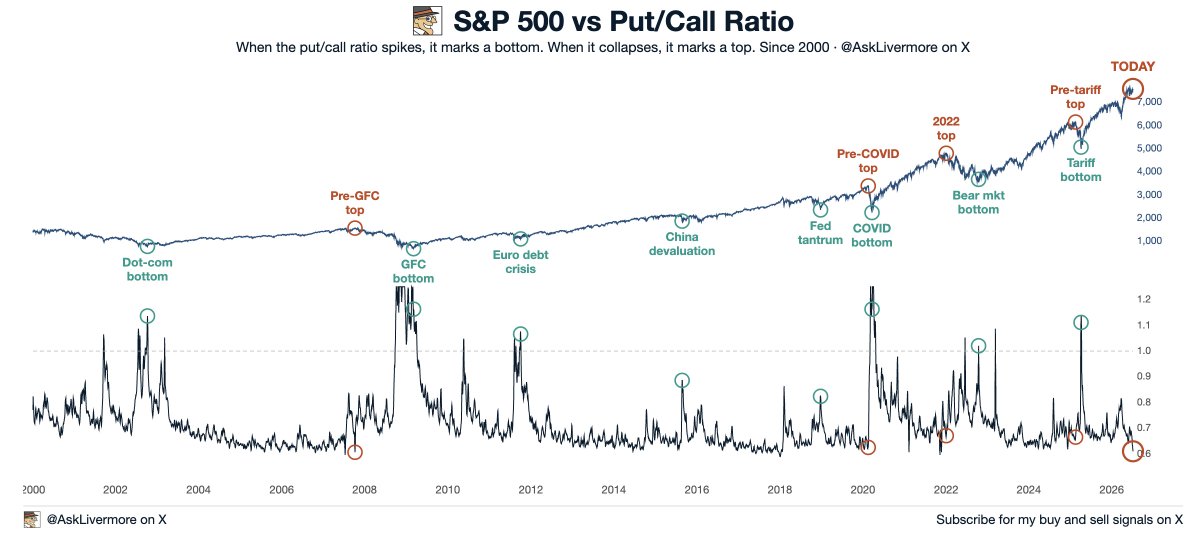
The put/call ratio tells you when everyone is panicking and when everyone is too comfortable.
Every single time the put/call ratio spiked above 1.0 since 2000, it marked a generational buying opportunity:
- Dot-com bottom (2002)
- GFC bottom (2009)
- COVID bottom (2020)
- Tariff crash (2025)
Every single time it collapsed below 0.70, a pullback followed:
- Pre-GFC top (2007)
- Pre-COVID top (2020)
- 2022 top
- Pre-tariff top (2025)
Right now? The put/call ratio just hit 0.61, the lowest since December 2020. That means options traders are the most bullish they've been in nearly 6 years.
Does that mean sell everything? No.
But it means this is the time to stay balanced, not all-in into one sector. The best buying opportunities will come soon, stay patient.
When everyone is greedy, be cautious.
When everyone is fearful, be aggressive.
This is the reason why we are outperforming the markets together. Save this, and you'll be rich during bull markets, and you'll survive during bear markets.
- At market bottoms, financials and tech lead.
- At the top, energy and staples take over.
- In bear markets, healthcare and utilities outperform.
My cycle repeats every time.
Knowing where you are in my cycle tells you exactly where to be overweight.
Save this. Study it. Use it.