Official links are found in my bio.
I’ll let my results speak for themselves.
Both of my wins & losses, I’ll share them.
First 25 members to join = FREE VIP spot.
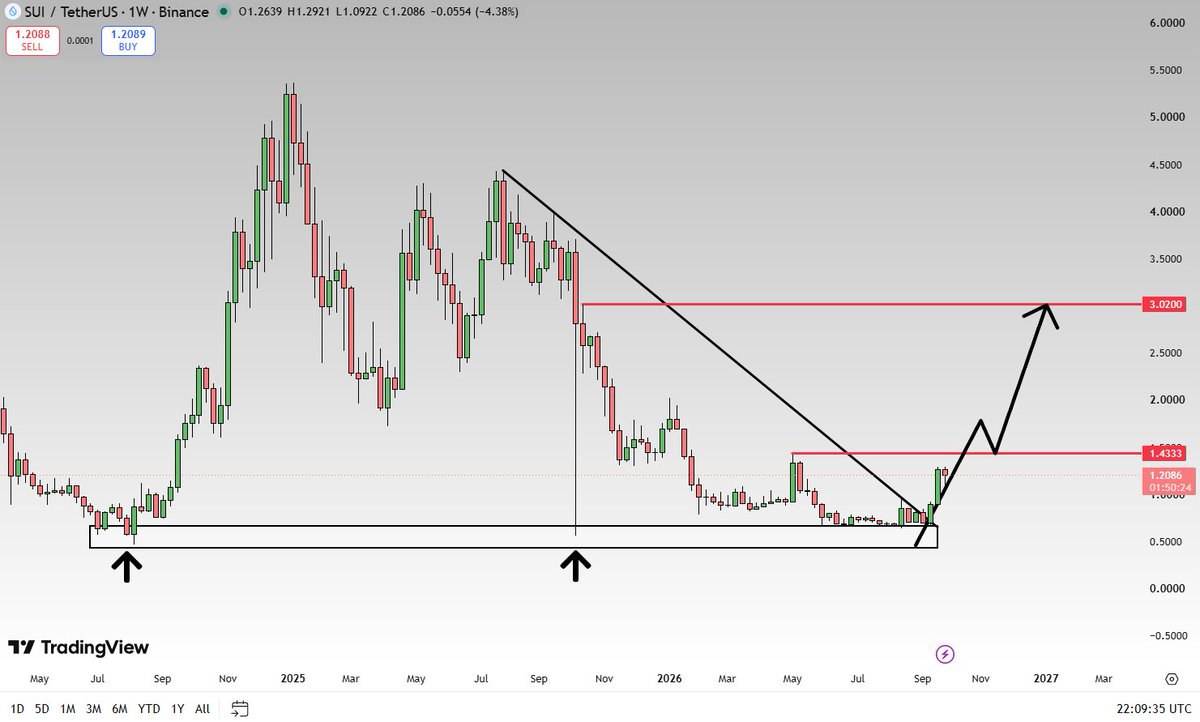
$SUI weekly chart looks amazing.
3 weeks ago, price confirmed a breakout.
Candle close above red line = continuation.
Candle close below red line = price rejection.
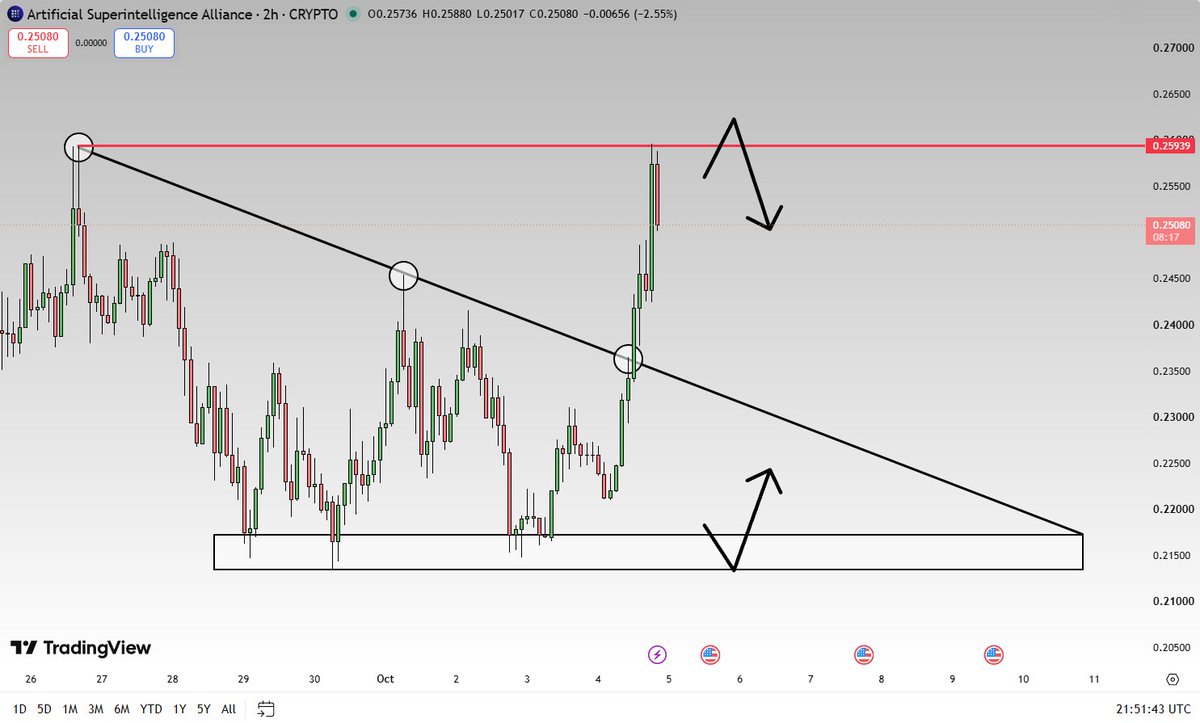
$FET 2H Timeframe Update:
Price broke-out of the triangle pattern.
Clear rejection once price hit resistance.
Close above red line = bullish continuation.
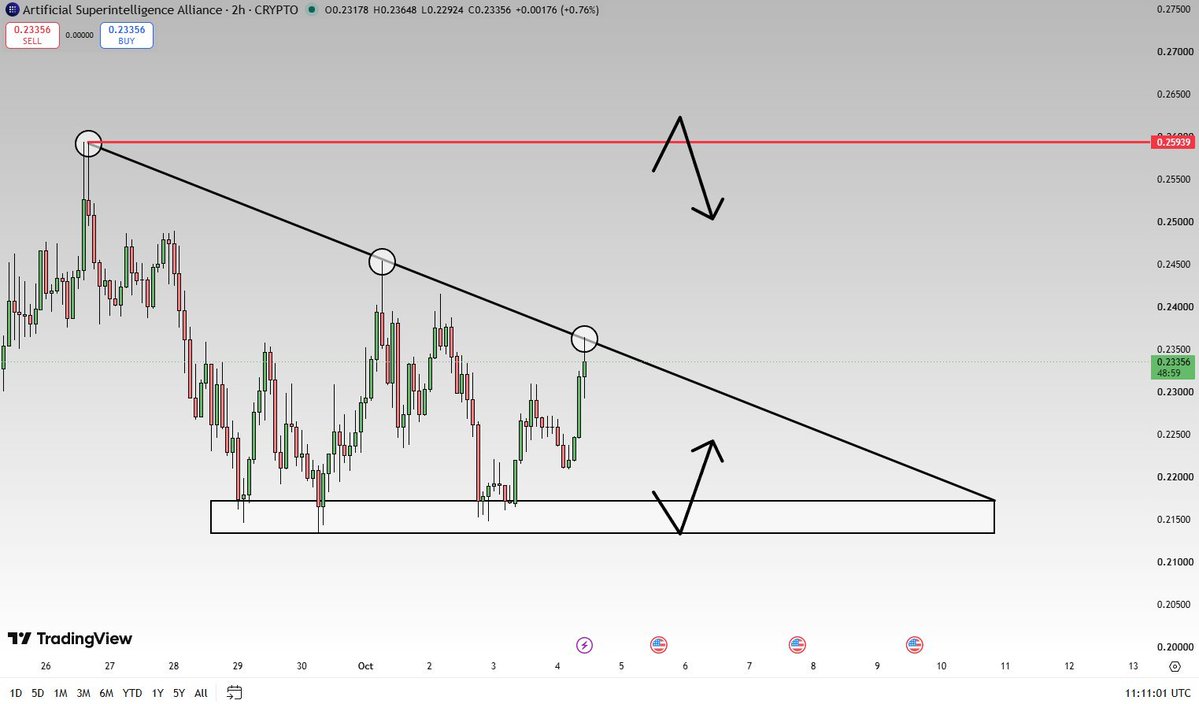
ethereum:0xaea46a60368a7bd060eec7df8cba43b7ef41ad85 2H descending triangle active.
Monitor the next few candles ahead.
Although the support below must hold,
Possible target is the resistance above.
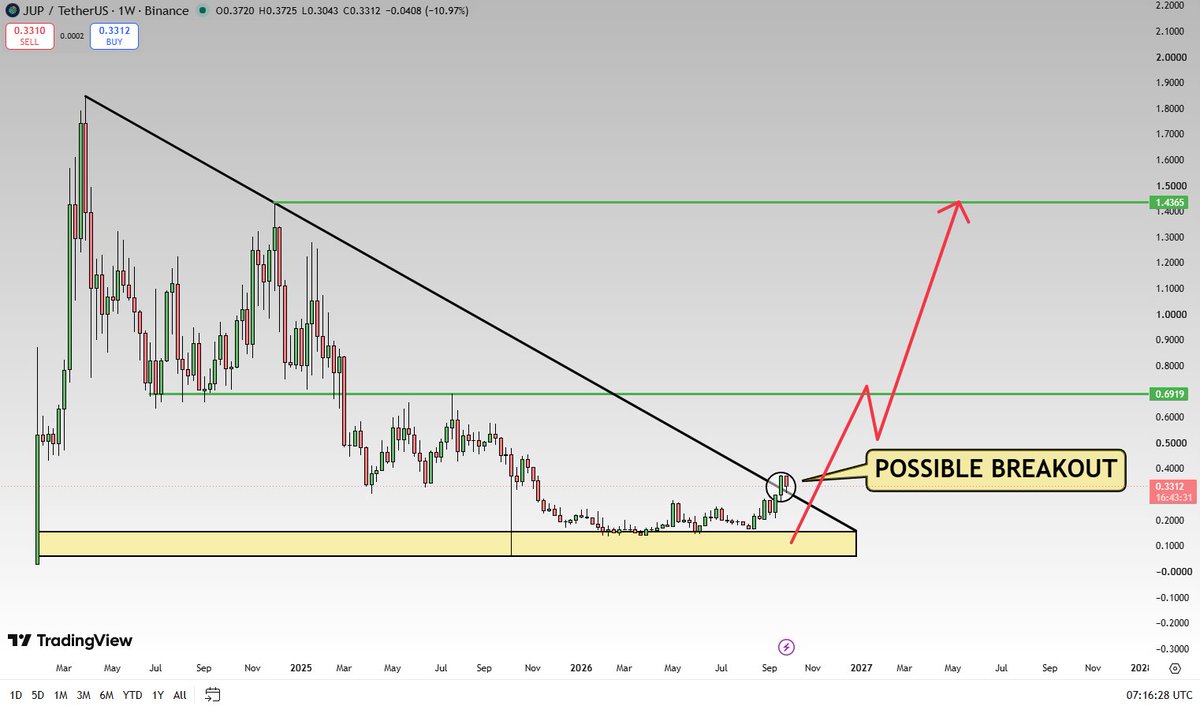
$JUP confirmed a bullish candle close.
Keep in mind, this is a 2-year downtrend.
The coming move is insanely crucial here.
Interesting times ahead for $JUP holders.
ethereum:0xaea46a60368a7bd060eec7df8cba43b7ef41ad85 2H descending triangle active.
Monitor the next few candles ahead.
Although the support below must hold,
Possible target is the resistance above.
hedera-hashgraph:native weekly chart is bullish.
Price broke out of its 1Y downtrend.
Expecting price to hit red line in time.
Might take a while, but so far so good.