The real fun will begin once we see these two projects start making moves again $ONDO & $CPOOL.
Over the past few weeks, they’ve been holding up, building a strong base, and their teams have been cooking lately with updates and roadmaps.
It’s just a matter of time before people start chasing these two at higher prices again.
Remember : Now is the moment for you to build your positions on them not when they are up 2x.
#ONDO #CPOOL
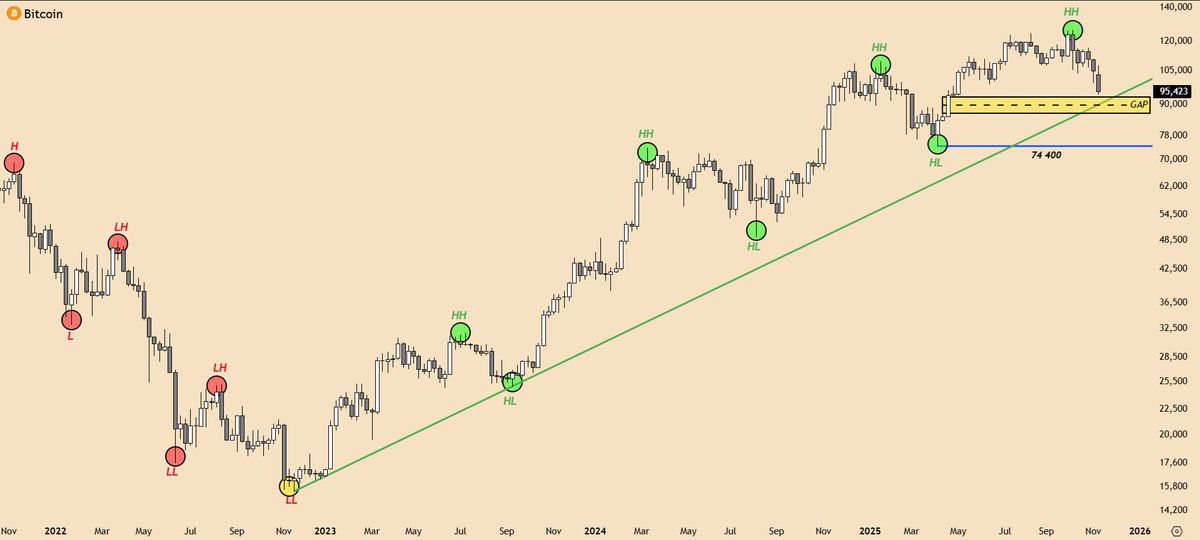
BTC - If we take the "C19-nov '22" impulse, we will find that the 15k bottom was exactly the 50% pullback. Now we are just turning the 69k area into a support area. Fib 1.618 gives us 400k level. Even more, these levels exactly match with BTC/M1 thesis.
BTC/M1 - I'm not a big fan of patterns but I can't also ignore the 6+ years of inverse (bullish) Head and Shoulders pattern. Technically it has its breakout and now it's retest of the neckline. This type of pattern and retest is signaling for bullish moves in the future.
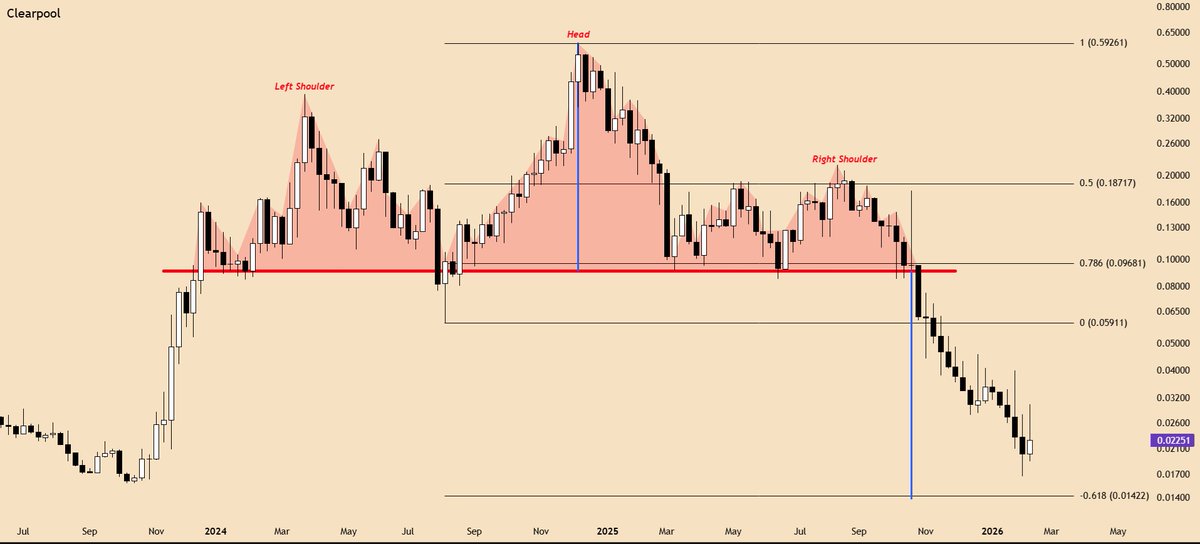
When you're in crypto market you must expect everything! Even that I'm bullish for $CPOOL, I know that there is a bear case scenario also. And you must know it to make informative decision! I did take my risk and responsibility of my investment. And I'm ready for both scenarios.
There we are. We closed the weekly candle with a body under 74.4k level. Yes, officialлy the structure is broken. But that doesn't mean you have to panic sell everything. It means it is time to DCA and ignoring the whole useless noise. #Bitcoin will die and will survive again!!!
2 more days b4 weekly candle close for #BTC. IF it closes with a wick, this will be a good sign. But IF it closes with a body, under the 74.4k level, this will be a sign for a broken structure & trend change. It will highly increase the possibilities of a downtrend continuation.
2 more days b4 weekly candle close for #BTC. IF it closes with a wick, this will be a good sign. But IF it closes with a body, under the 74.4k level, this will be a sign for a broken structure & trend change. It will highly increase the possibilities of a downtrend continuation.
@i_am_jackis@i_am_jackis, compare the whole history chart of NVDA with BTC. It's kinda intresting and this also align with the S-curve of adoption theory.
@CryptoTony__ More like 6 years, not 7.
- from march '20 to march '21 - 1st year
- from march '21 to march '22 - 2nd year
- from march '22 to march '23 - 3rd year
- from march '23 to march '24 - 4th year
- from march '24 to march '25 - 5th year
- from march '25 to march '26 - 6th year
The market is boring and this means it is a good time to accumulate some alts. $CPOOL looks bullish, even with the red 2025 year. With this giant 2 years hidden bullish divergence things can get realy wild in a positive perspective any time. Remember to #DYOR all the time!
More than 2 years of hidden bullish divergence in $CPOOL chart. This type of divergence is also known as absorption process. Will it be played? I don't know! Next couple of weeks and months will show. Patience is the key!
Before the EOY a quick reminder that we are still in a #BullMarket for #BTC. History of RSI indicator also shows us that we are now in the bottom area after the local pullback. What comes next time will show us!
As a continuation of my bullish thesis for #Crypto and #BTC, lets see a little and simple technical and trading lesson for what we need to have attention right now before we call it a bear market. Because it STILL NOT a bear market.
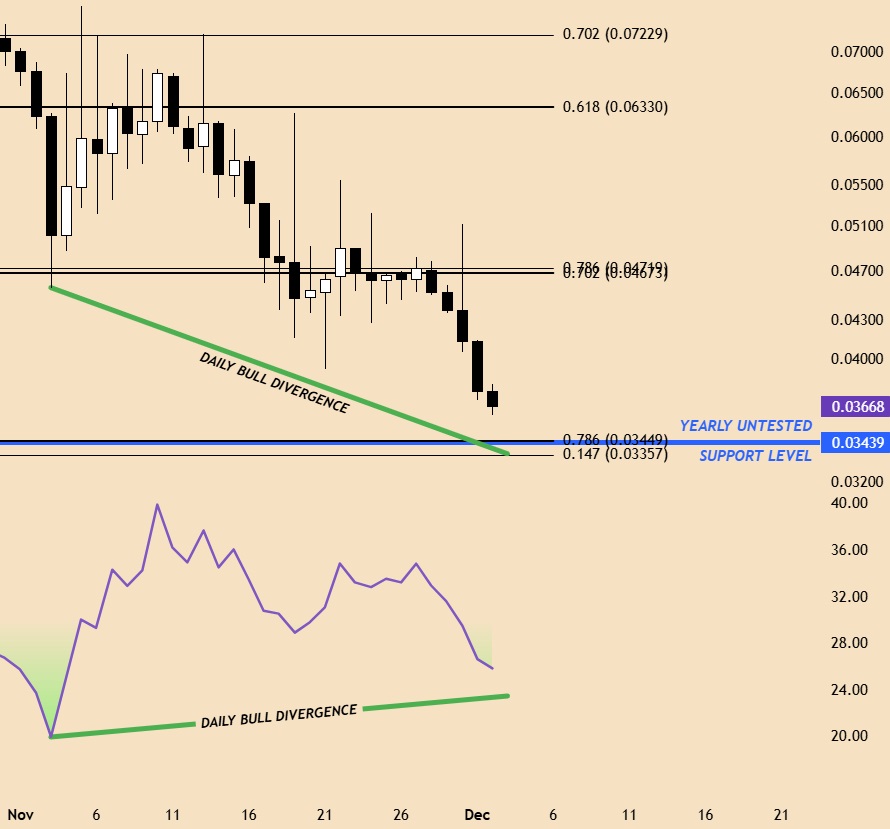
$CPOOL still forming daily bullish divergence. Will it be played? - Yes, I think so, sooner or later. When? - I don't know. But I know that many people will leave here. It's not about your success! It's about how long can you be patient to deserve it! Wish you all happy holidays!
That's how usually looks the bottoming forming process. 4-hours and Daily time frames on $CPOOL chart both shows bull divergence right next to key support levels. The end is neer. Just a bit more.