#BTC .D + #USDT .D + #USDC .D
This chart is much more accurate than looking at BTC.D alone.
$BTC .D only shows #Bitcoin ’s dominance decreasing, but that doesn’t necessarily mean money is flowing into altcoins. It could simply be moving into stablecoins.
This chart gives us a much clearer picture.
When it moves lower, it means capital is flowing out of Bitcoin and stablecoins and into altcoins - exactly what we want to see during an alt season 👽
Fascinating chart on $SUI vs. $BTC
I started checking the altcoin vs. btc charts slightly more over the course of the past few weeks to see whether I can find some hidden signals of a market reversal to come.
The good part: yes, there are arguments.
A massive bullish divergence on multiple timeframes.
This was a copy/paste of the chart of SOL vs. BTC, yet, Solana has already seen a strong move against Bitcoin.
It's about time before SUI follows through.
$BTC 1D
Despite all the fear on the TL, we still have bullish divergences on multiple TFs (H4-1W) + bullish price action (volume down + price down).
I’m putting higher odds on a bounce given the signals.
$btc
My short position in the 59,200s is currently operating according to the scenario of a retest of the new resistance area. 📉
🚨 For the downside target, I'm still aiming for the 56,500s. However, I always have a plan B ready to anticipate dynamic market movements.
If the price breaks back above the 60,000s, I will consider yesterday's breakdown merely a deviation or noise.
If that scenario occurs, I will immediately cancel the short position and switch to a long position.
Trading isn't about forcing things, but about reading the flow and adhering to risk limits.
Continue to monitor these levels. 🧠
Disclaimer: NFA. DYOR.🔥
$BTC Keeps consolidating in this price range.
Marginally higher lows and equal highs.
Look out for whichever direction breaks first, I think a quick move should follow after that seeing how compressed this is becoming.
$BTC
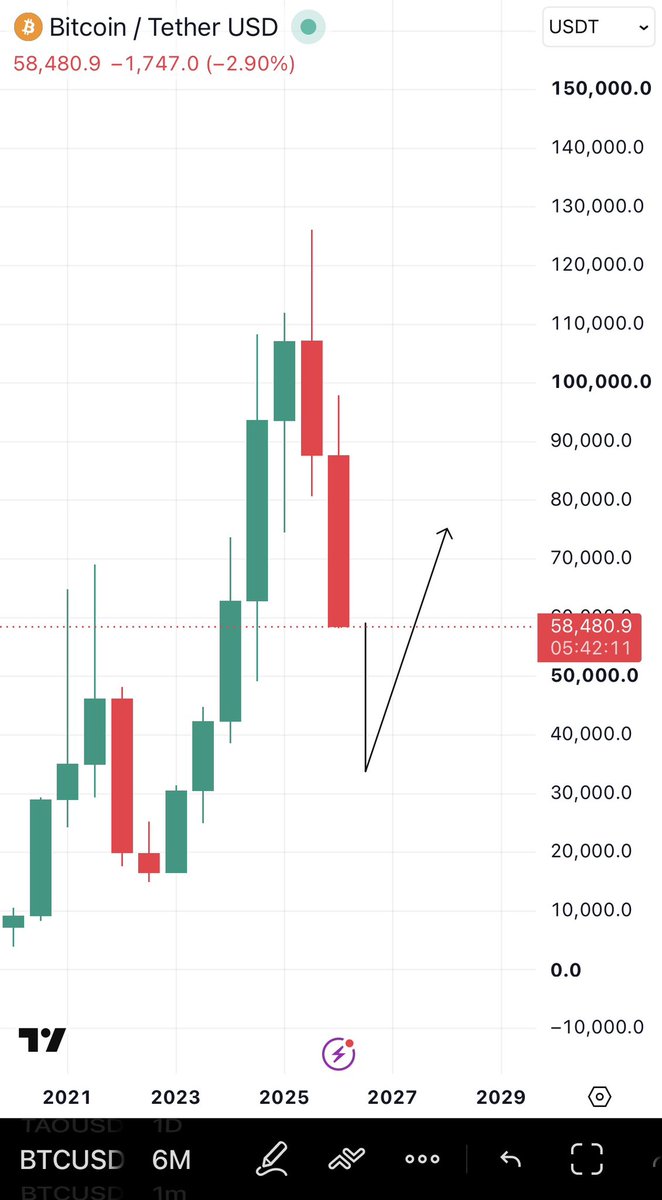
For the first time, BTC is currently testing the highest monthly close from the previous cycle top.
We never saw that happen in either the 2018 or 2022 bear markets.
In those cycles, BTC never came back to test the highest monthly closes from the 2014 or 2017 cycle tops.
So, I think July is going play quite a large role in shaping the rest of this bear market.
This is a reasonable area to see monthly support hold and produce some counter-trend action.
Apart from the 2021 cycle top, this region also acted as a major base throughout 2024 before BTC eventually rallied toward $126K.
Therefore, we have a considerable amount of historical price action and liquidity sitting at this level.
If we continue following prior bear market behaviour, July has typically been where the final Q3 relief rally begins before the latter stages of the bear market.
The ideal scenario would be a wick below this monthly support into the mid-$50Ks, setting the monthly low for July, before reclaiming the level and closing the month green.
That would fit the historical pattern almost perfectly.
But if July continues the downtrend and closes below this pivot, then we're looking at something structurally very different.
BTC would be losing a monthly support level it has never had to defend before, while also breaking the historical pattern of the mid-cycle rally beginning in that period.
That would be one of the most bearish structural developments we've seen this cycle.
And in my opinion, it would open the door to testing the boundaries of $50K and below.
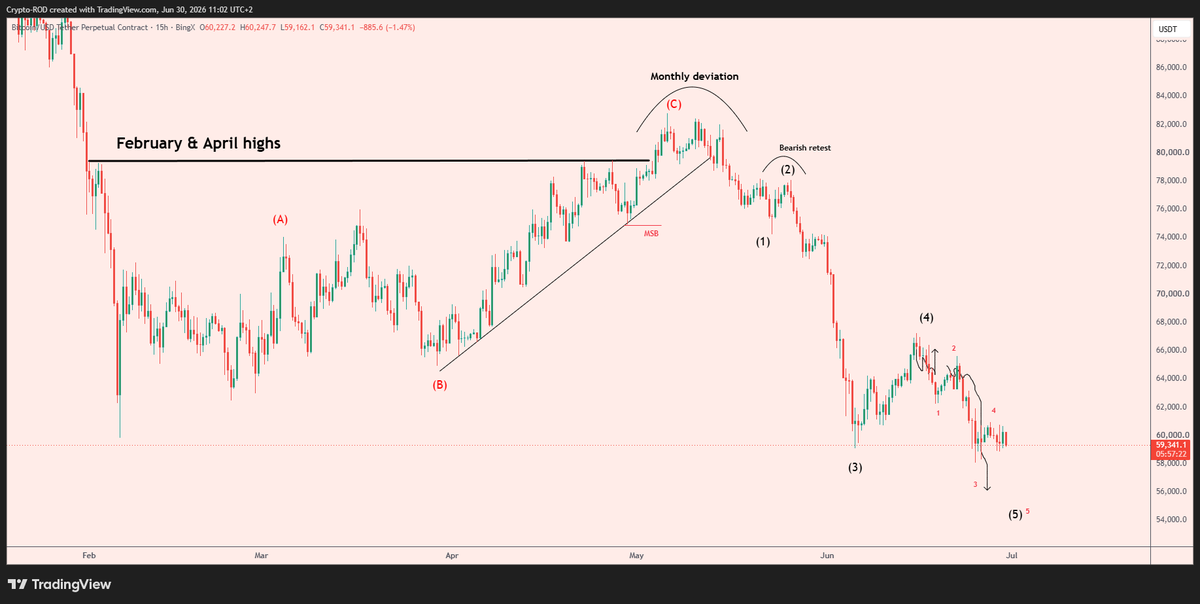
New $BTC update after calling for 60k from 79k:
Chop between 58k and 62k.
Sellers remain in control and every time $BTC fails to break resistance it looks weaker and weaker.
Since the drop from 65k, price has been unable to show any real reaction, but we also haven’t seen a clean breakdown below 58k yet. That said, I think it’s only a matter of time before that move happens.
I’m talking HTF here. On LTF, if sellers step back for a few days and some bid appears, we could still see a bounce towards 65k, but my HTF target remains 42–44k even if that comes.
If sellers stay in control from here and $BTC is unable to reclaim 62k soon, I don’t think we’ll even get that complacency bounce, and we’ll head toward my HTF target in my opinion.
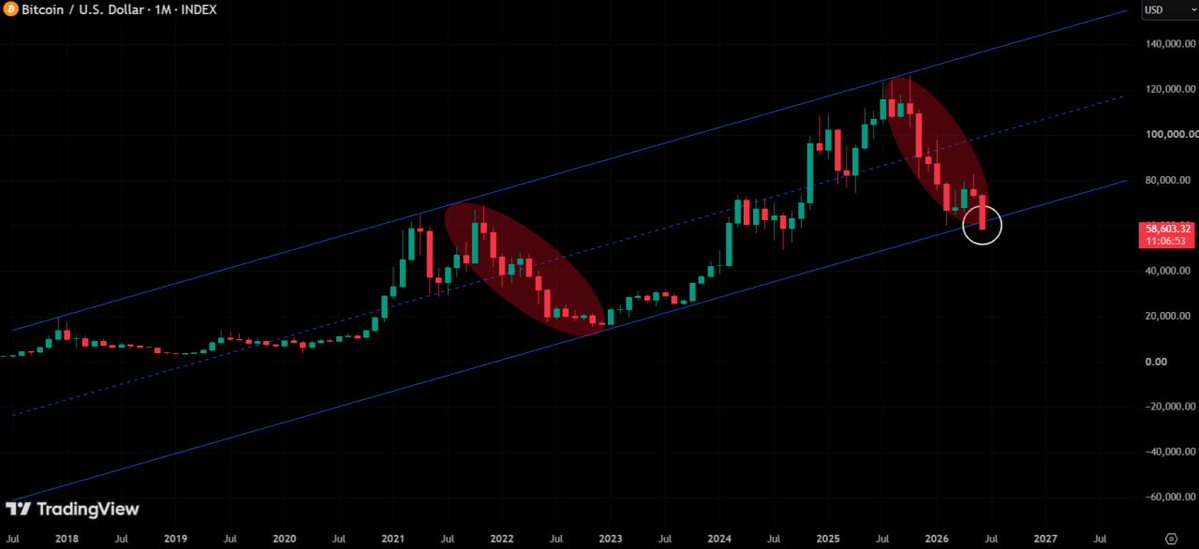
This is the most important Bitcoin level of the entire cycle.
$BTC is testing the exact macro trendline that has marked every major cycle bottom.
If bulls defends this level, the next leg higher could be next.
$BTC warning
Selected last 2 years of data on Tuesday's only
Filtered for all Tuesday's that closed bearish
- 95% of bearish Tuesday's put the high in later
- 97% of bearish Tuesday's put the high in further
I am bearish, but not short yet, as this daily high is weak
Bitcoin is trading around $58,700, and so far I don't think much has changed.
We lost the $59k support yesterday.
Since then, the market has been trying to stabilise, but I haven't seen anything yet that suggests buyers are back in control.
$61k is still the level that matters.
Until Bitcoin can reclaim that level with genuine spot demand, I think every bounce needs to be treated with caution.
Right now, this still looks more like a market searching for liquidity than one preparing for a sustained move higher.
We lost a major support level yesterday.
Now the bulls need to prove they can take back control.
Until $61k is reclaimed, I still think the downside remains the higher-probability move.
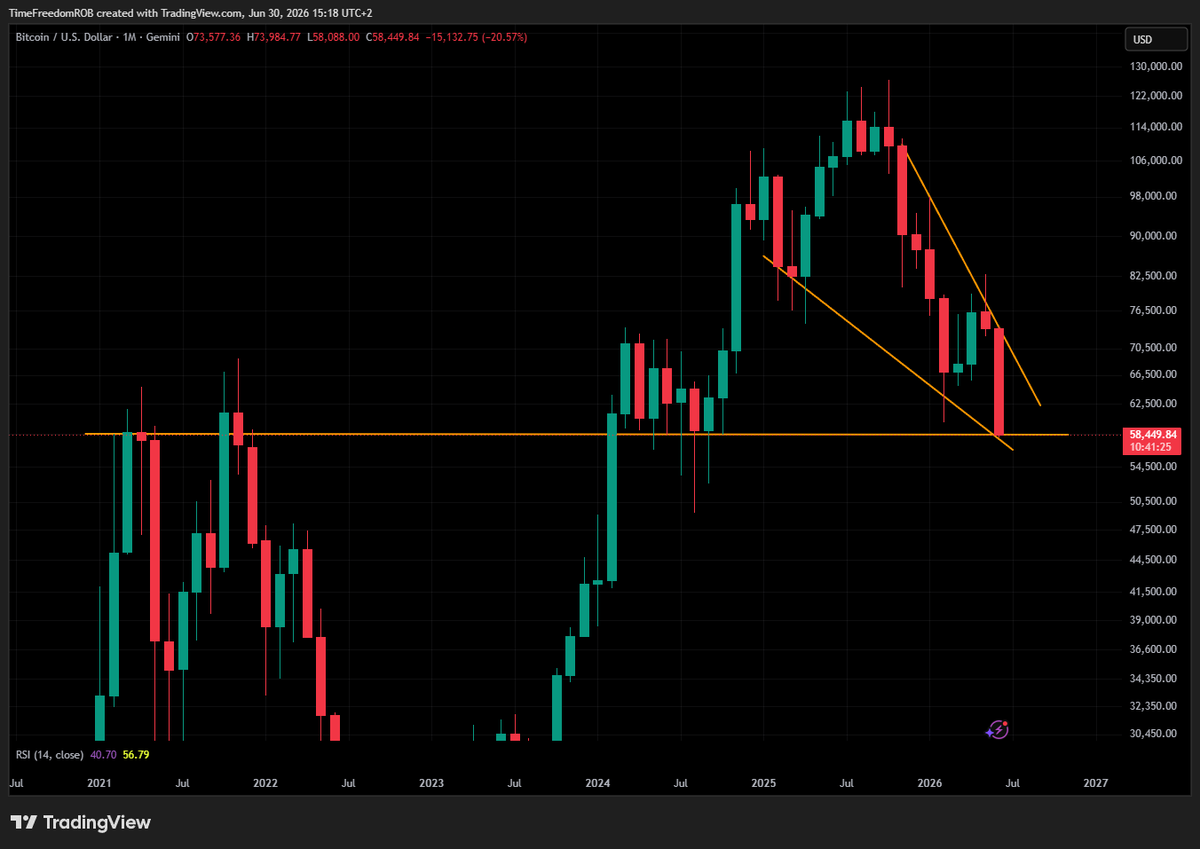
Unless a miracle happens today, this will be the first Monthly sequence of LH & LL low since May 2022.
The last one resulted in an additional -52% drop since that low
Will this time be different?


![davthewave's tweet photo. #btc price meeting shorter-term and longer-term resistances.... and the LGC [Logarithmic Growth Curve]. https://t.co/9u28QiuqgG](https://pbs.twimg.com/media/HMGqx9RbQAA1d5N.jpg)


![davthewave's tweet photo. #btc price meeting shorter-term and longer-term resistances.... and the LGC [Logarithmic Growth Curve]. https://t.co/9u28QiuqgG](https://pbs.twimg.com/media/HMGq66lbkAAftiw.jpg)