Weather/climate enthusiast and forecaster.
Info on global weather models, weather patterns, winter, stratosphere, polar vortex, custom graphics, and more...
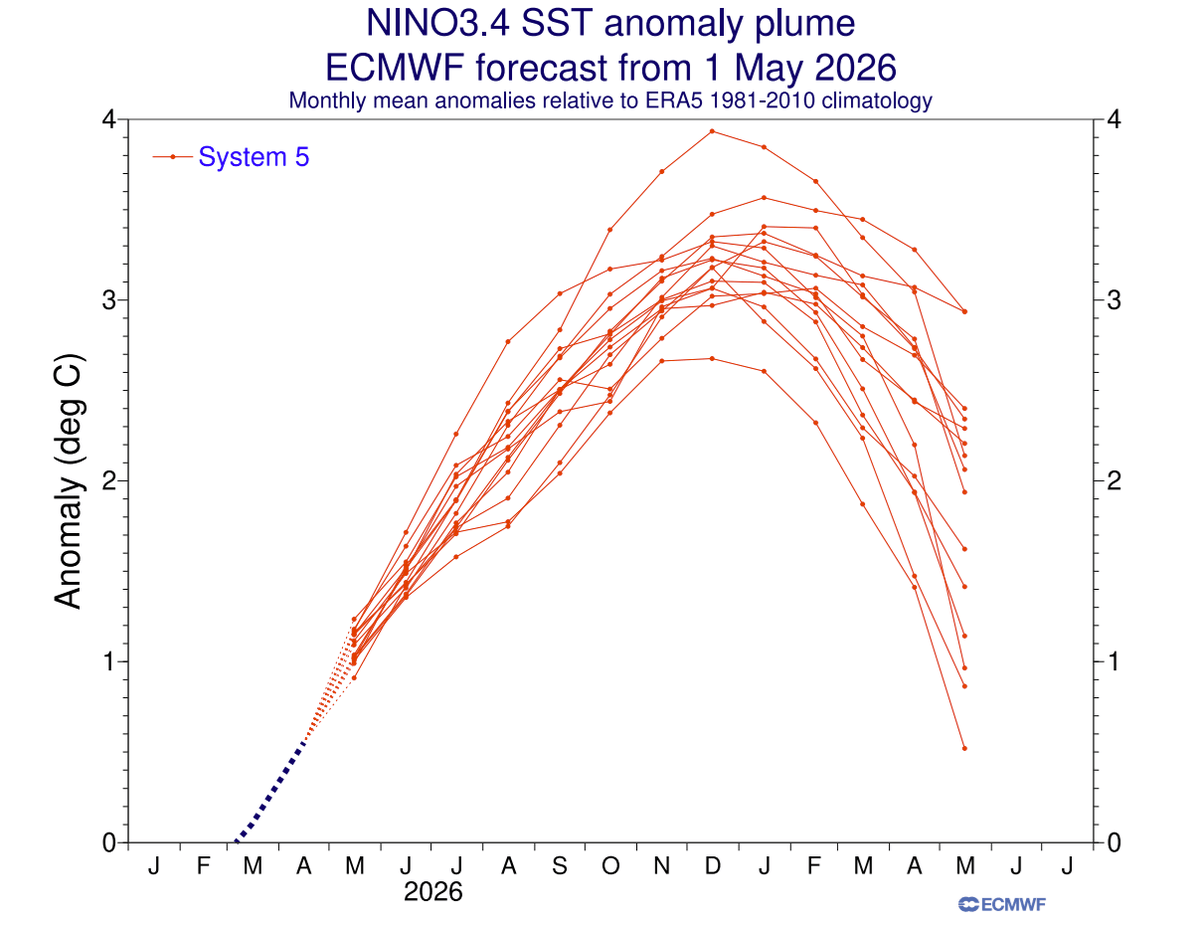
Comparing some of the latest forecast runs to past strong El Niño events shows we are in for quite a historic ride, if verified. Both the BOM and CFSv2 use the Relative ENSO index forecast. Interesting to see how close the new BOM forecast is to the ECMWF.
@AndyHazelton@webberweather@PaulRoundy1@tcrawf_nh@BenNollWeather
@novasufferer134@AndyHazelton It would put it 3rd at that October data point, yes. We have yet to see what the full ECMWF RONI peak looks like. But the extended ONI forecast is quite significant.
Comparing some of the latest forecast runs to past strong El Niño events shows we are in for quite a historic ride, if verified. Both the BOM and CFSv2 use the Relative ENSO index forecast. Interesting to see how close the new BOM forecast is to the ECMWF.
@AndyHazelton@webberweather@PaulRoundy1@tcrawf_nh@BenNollWeather
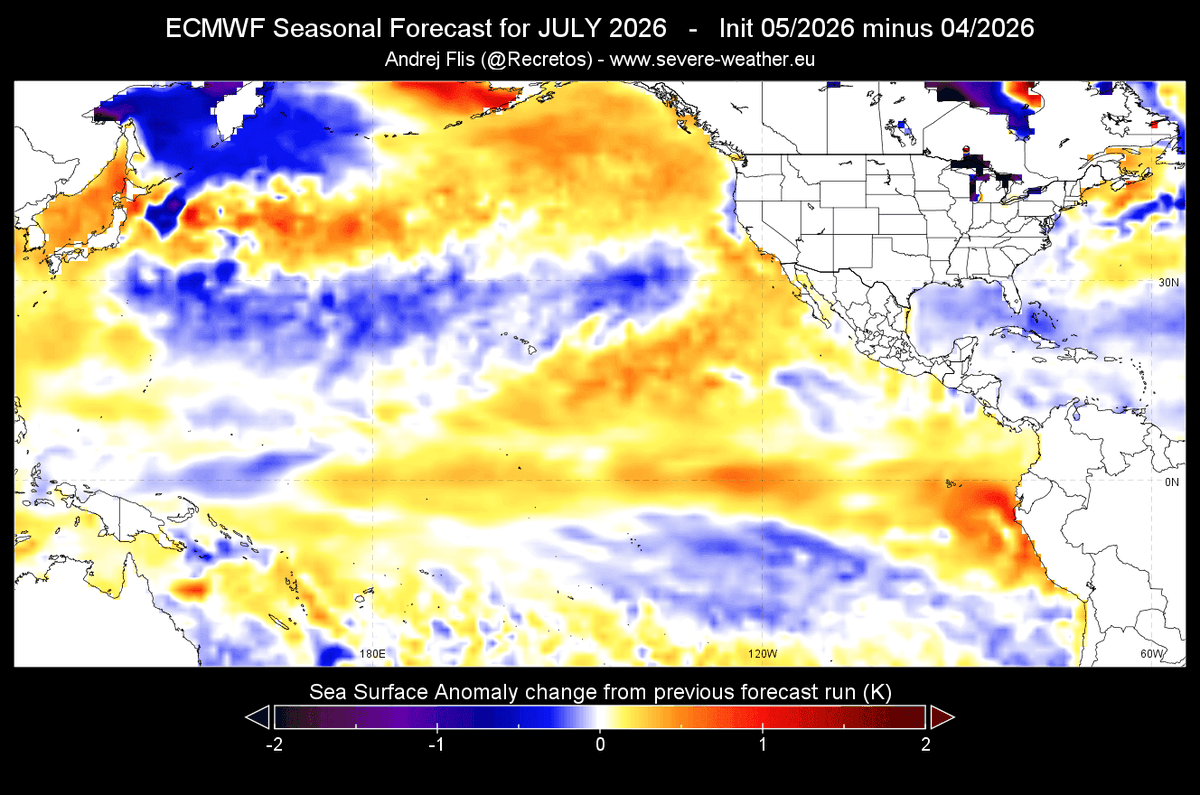
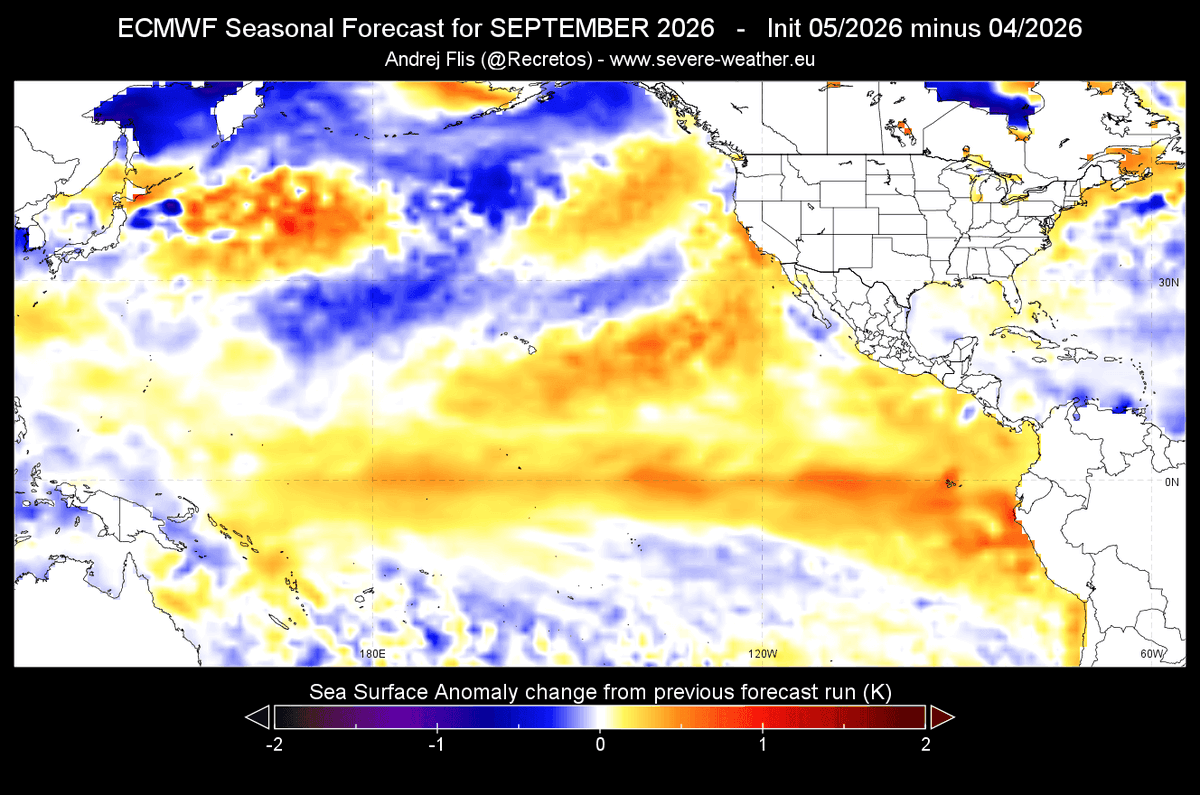
@AndyHazelton Also, comparing the latest ECMWF run to the previous run for July and September, we can see a stronger El Niño, but also a bit more intensity in the "+PDO" signature
@tcrawf_nh@AndyHazelton@webberweather@PaulRoundy1 I don't think it should in a grand way, similar to how the stratospheric U10mb winds dont really matter that much if they bottom out at 1m/s or -1m/s during an SSW event. But while small, the 0.3K delta should not be totally insignificant.
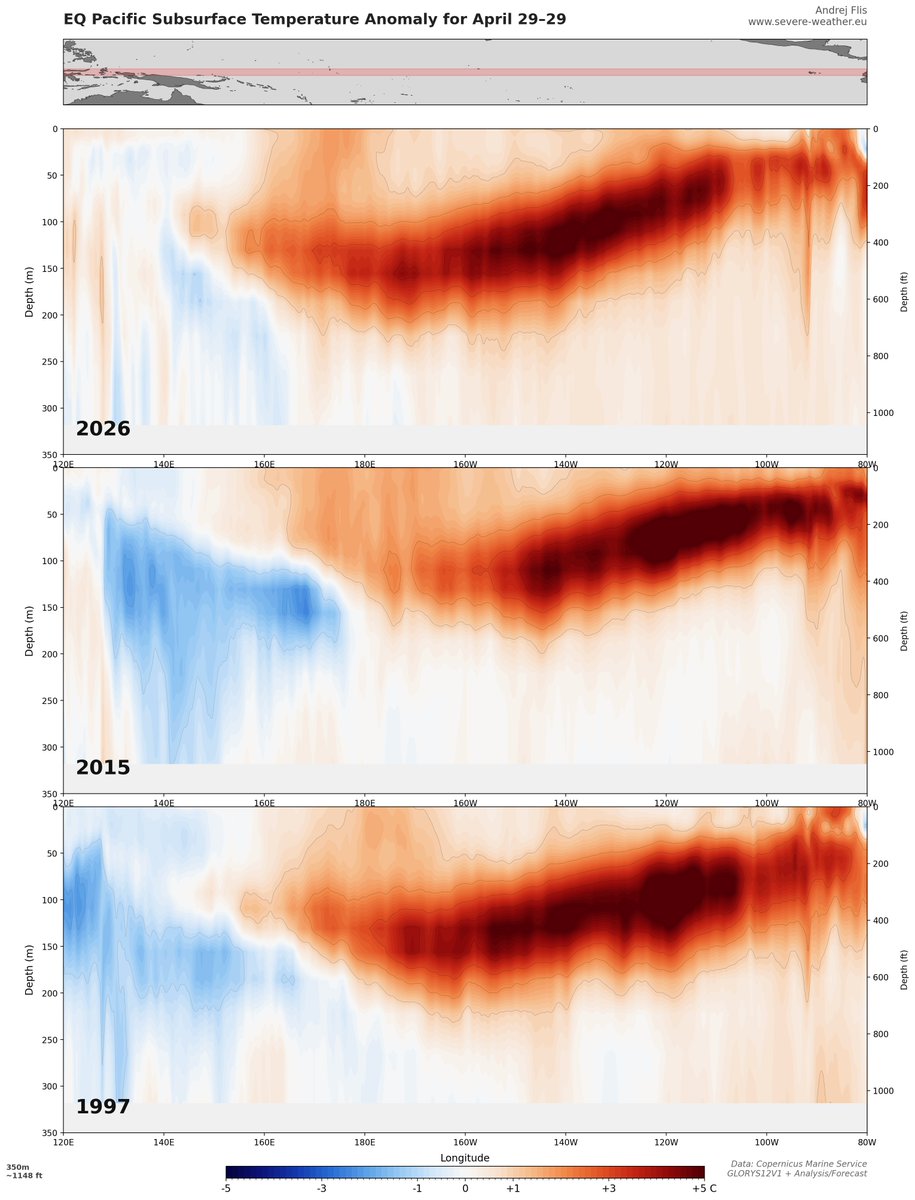
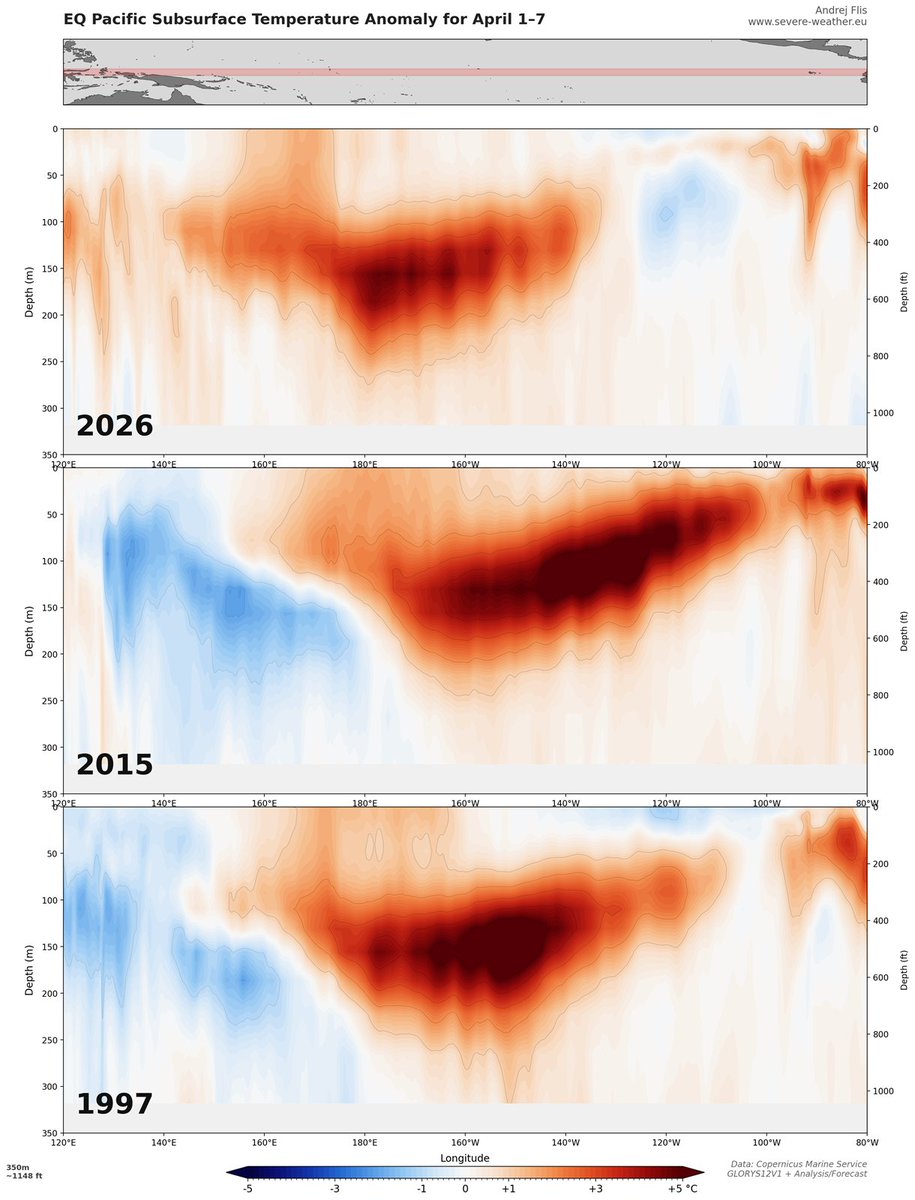
Looking at the latest snapshot comparison to the last 2 Super El Niño events, we can see a significant speedup of the subsurface warming evolution in 2026 compared to the start of the month.
@AndyHazelton@webberweather@PaulRoundy1@tcrawf_nh
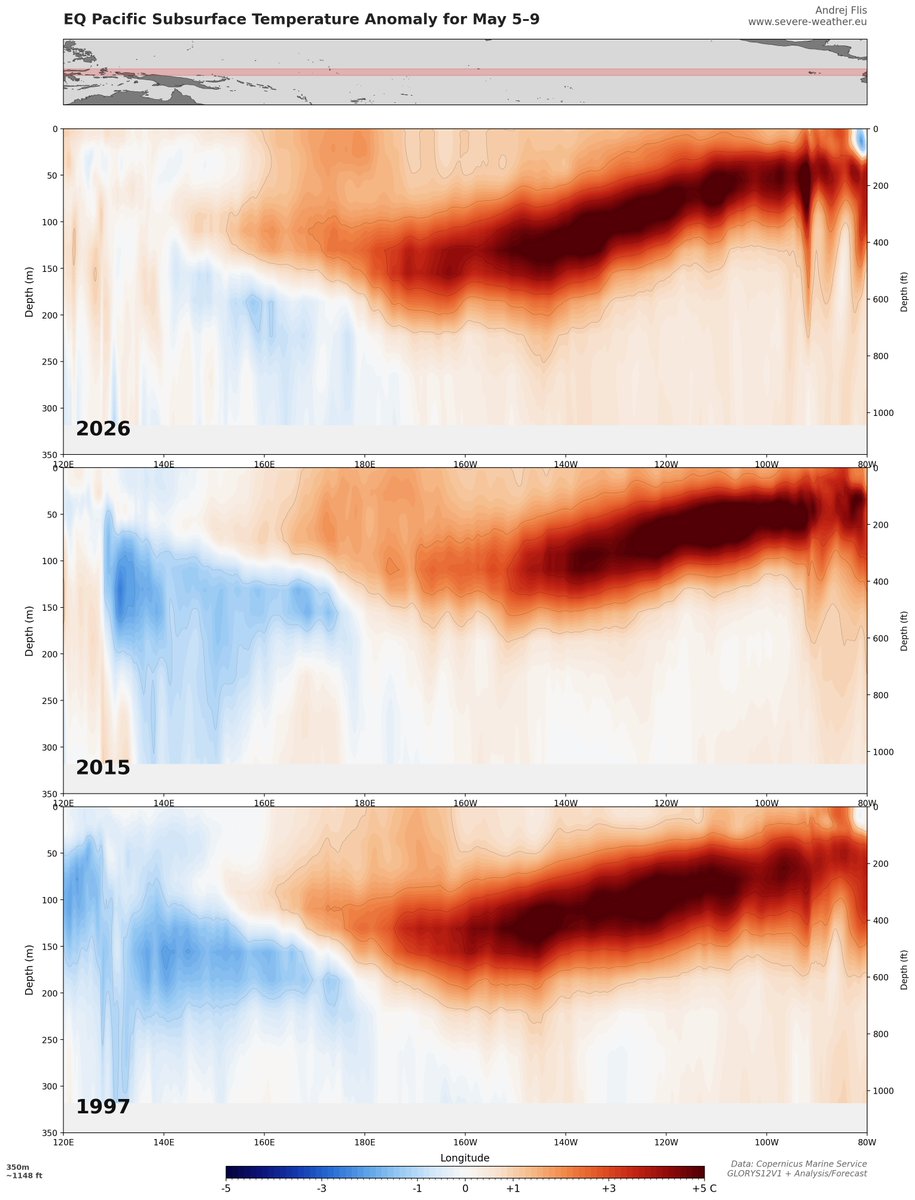
@AndyHazelton@webberweather@PaulRoundy1@tcrawf_nh Last but not least, here is also the comparison graphic, using the May 5-9th forecast data, comparing it to the past 2 Super events. Also adding the CFSv2 Relative Niño index for good measure.
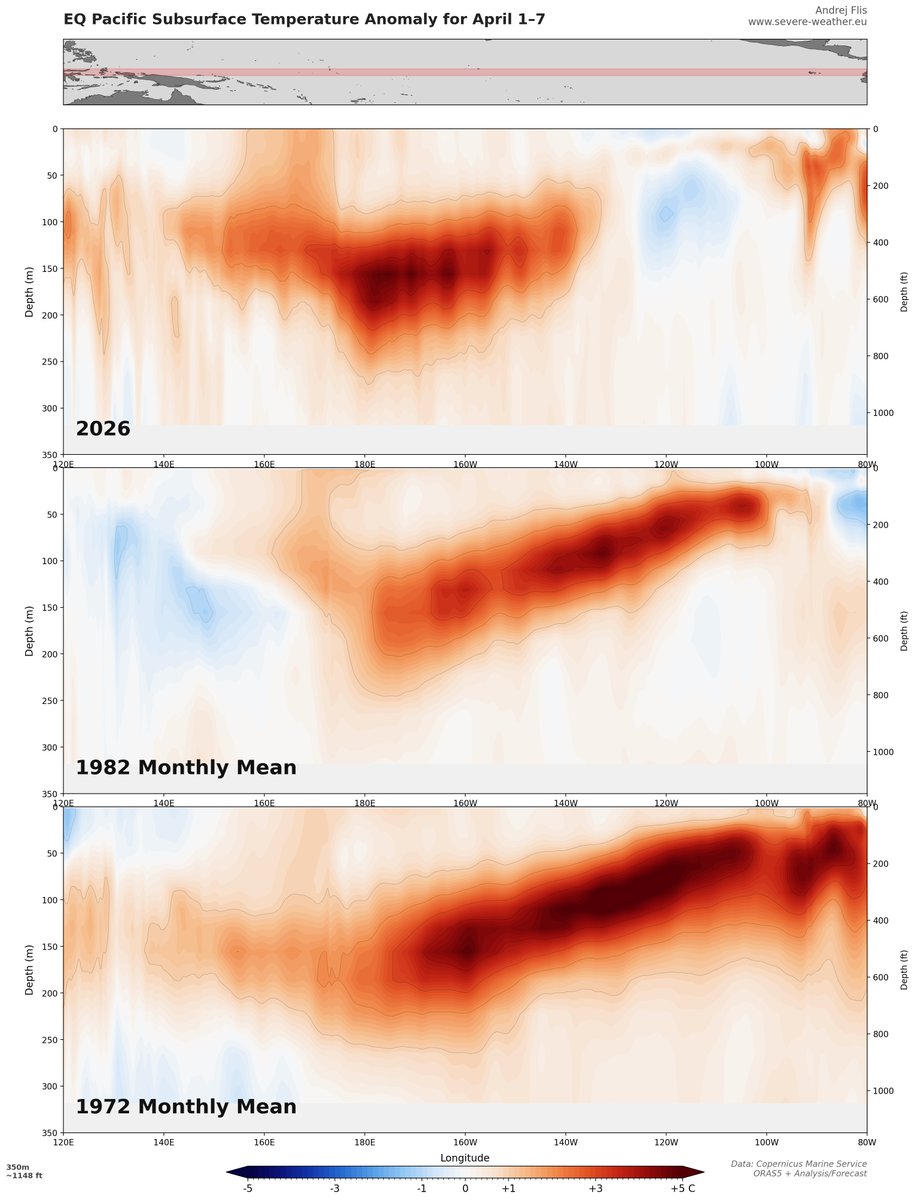
This is now also the revised plot for the older two Super events, comparing the late April 2026 data to April monthly means, and the second graphic is the forecast for May 5-9, 2026, compared to the May monthly mean for past events. The forecast comes from the Mercator Ocean International system, forced by ECMWF IFS.
Looking at the month-to-date comparison to the last 2 Super El Niño events, we can see how big the OHC delta is in the western Pacific. Likely a stronger buildup, or perhaps just a time difference in the process evolution? @AndyHazelton@webberweather@PaulRoundy1@tcrawf_nh
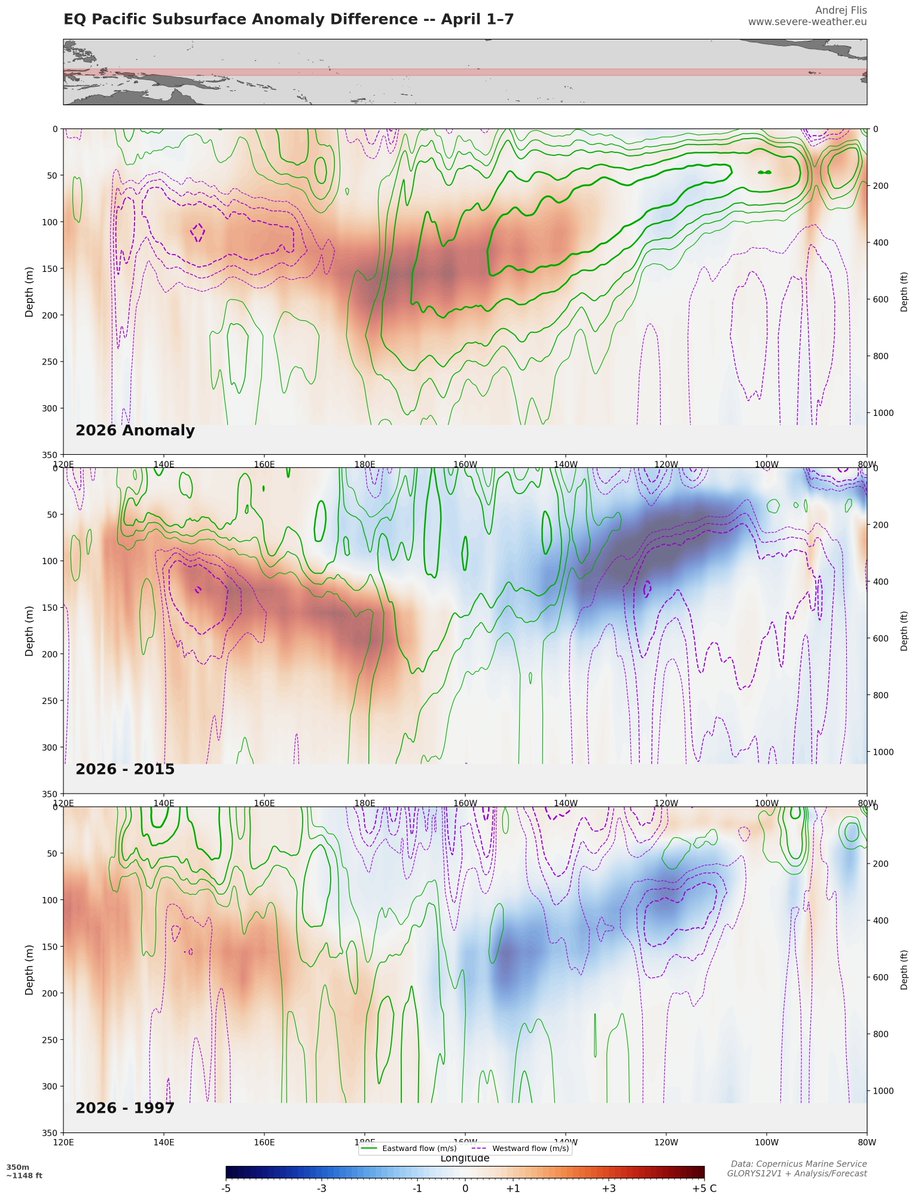
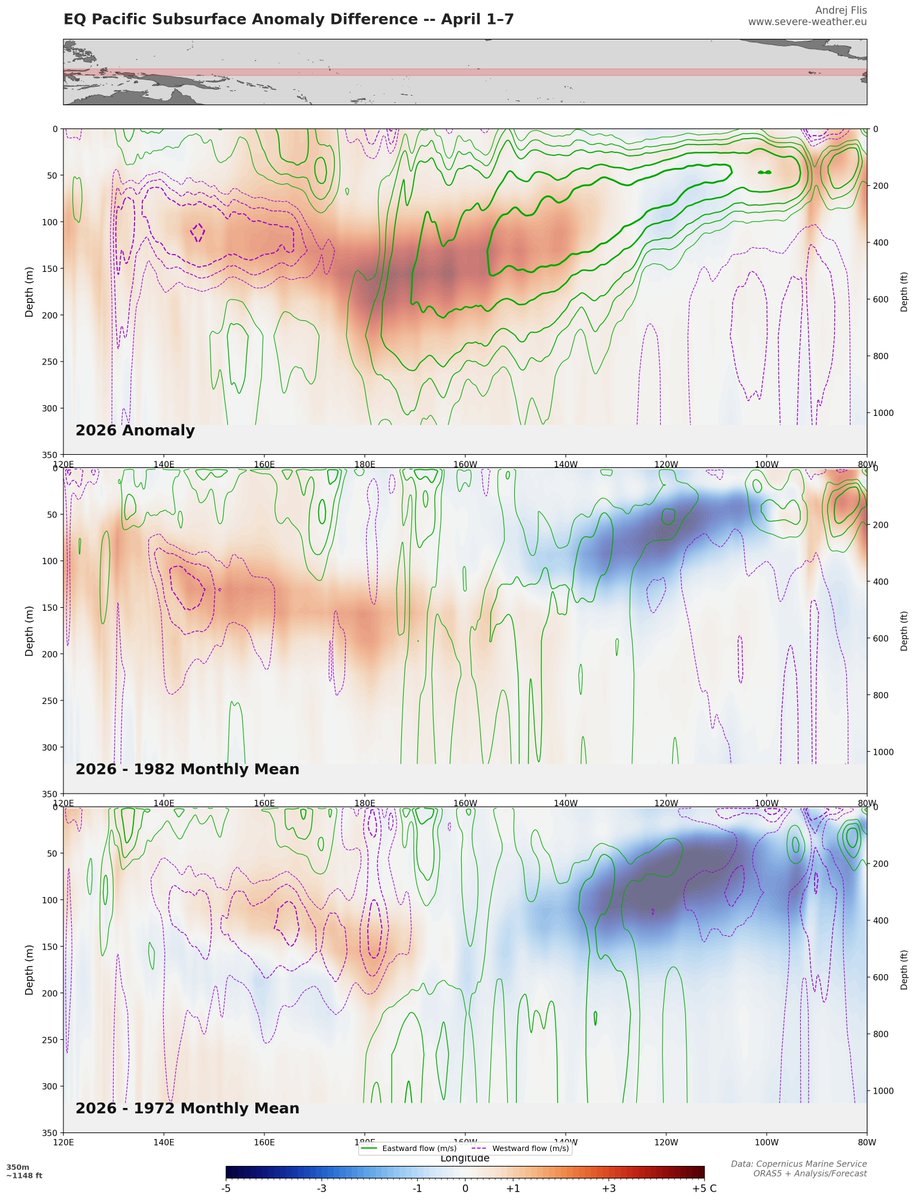
I decided to also load the zonal flow data for depth, and overlay the 2026 with the latest mean, and also do a comparison where/how the 2026 shows stronger/weaker zonal flow compared to past events. Will be really interesting to see the 2026 analysis plot in a week or two after the upcoming round of WWBs. But overall, stronger westerlies in the west are evident versus all years.
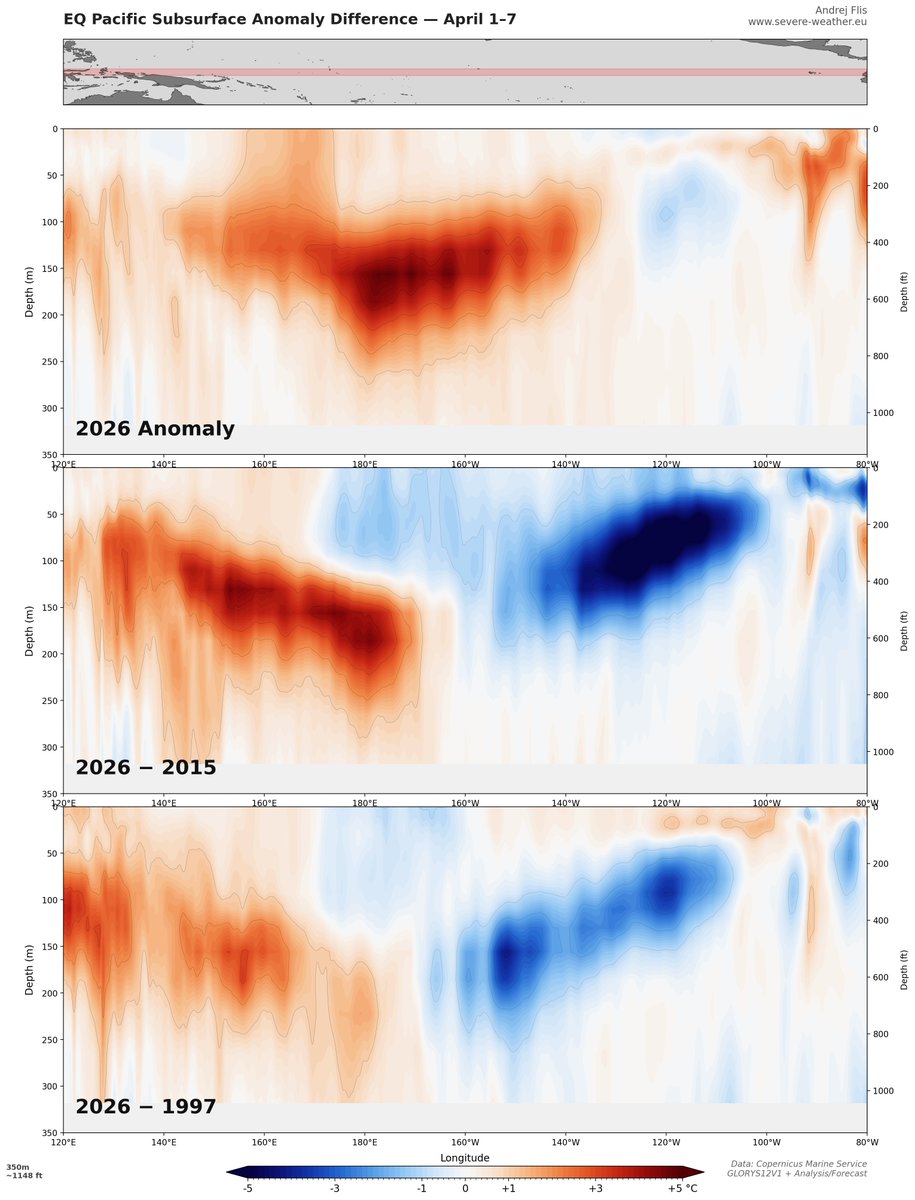
@AndyHazelton@webberweather@PaulRoundy1@tcrawf_nh The final comparison is a simple subtraction of anomaly fields, which shows the true delta between the events, with a much stronger western OHC in 2026, and a closer resemblence to 1997 than 2015.
@webberweather@PaulRoundy1@AndyHazelton@tcrawf_nh Saw this one earlier, it's a remarkable difference. Also further shows how the subsurface warm maxima this year is not "weaker" per se, but likely just at a certain point in development, and is soon going to be unleashed further.
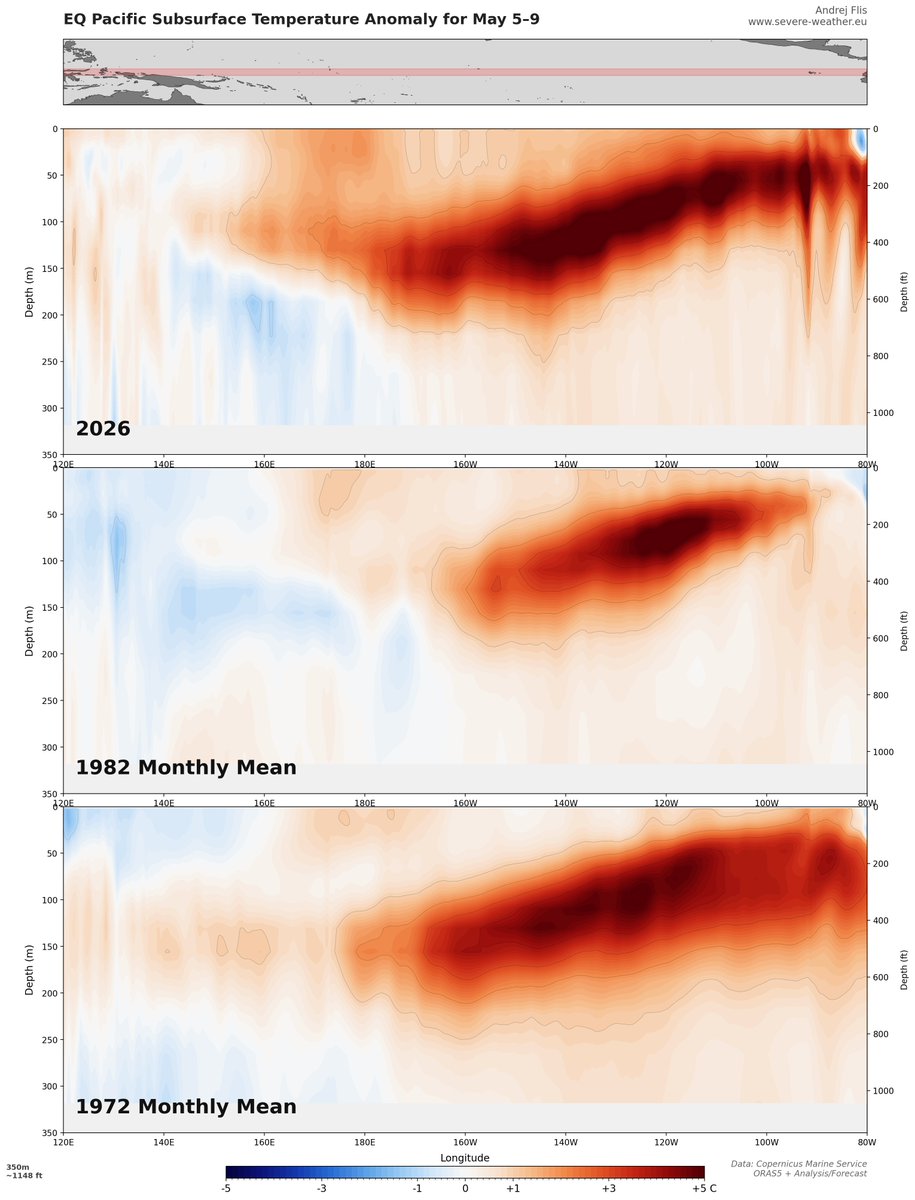
@webberweather@PaulRoundy1@AndyHazelton@tcrawf_nh Great find! I also plotted the monthly data for 1982 and 1972 as a comparison, and 1972 does seem to be the closest to 2026 of the bunch in the western regions, but weaker in the east.
@PaulRoundy1@AndyHazelton@webberweather@tcrawf_nh Yes, the 1997 subsurface maxima was further east, which is why the negative delta between 180-100W. It looks like main difference could be just the time delta between the WWB events and the Kelvin Wave progression. Will revise these graphics weekly to see the progression.