This is one of the cleanest multi-year setups in the entire commodity space.
Look at the Bloomberg Commodity Index.
A massive cup-and-handle pattern stretching back over a decade is now pressing against resistance near 138.
If this breaks and holds, it won’t be a quiet move.
History shows these kinds of structures on the broad commodity complex tend to unleash a powerful, multi-month wave higher across energy, metals, and softs.
That means:
• Sticky inflation returning through the physical cost of living
• Central banks trapped between rising prices and soaring debt costs
• Accelerating capital rotation out of paper assets into real ones
The paper narrative of “cooling inflation” is about to collide with physical reality.
The breakout, if confirmed, changes the entire macro regime.
Physics > Paper.
$NATGAS played out almost like a roadmap.
Even though we pulled back before hitting my final targets, the move played out as expected. Now, we’ve just completed a textbook retest right at a massive structural support line (2.64).
The technical setup points to a strong bounce here, continuing the broader rally in tandem with Crude.
Energy structural physical deficits are aligning.
Physics > Paper.
@CTrader_Alex The setup is still running.
First was the break of the downtrend. Second was the retest. Price has already moved off that line.
A strong dollar can stall it into a range. That’s not invalidation. The monthly structure is still intact.
If the last few red days in metals have you staring at the screen - look at this instead.
$DBC is a broad commodity basket - energy, metals, agriculture priced against the S&P. That ratio just broke a multi-year downtrend.
That’s the start of the next commodity run, not a dead-cat bounce.
If you are in commodities, you are not fighting the trend.
@tradlvalu Yes. $DBC is the liquid ETF most people use to express that basket.
The chart was the Bloomberg Commodity Index itself - same neighborhood, not the same ticker.
This is one of the cleanest multi-year setups in the entire commodity space.
Look at the Bloomberg Commodity Index.
A massive cup-and-handle pattern stretching back over a decade is now pressing against resistance near 138.
If this breaks and holds, it won’t be a quiet move.
History shows these kinds of structures on the broad commodity complex tend to unleash a powerful, multi-month wave higher across energy, metals, and softs.
That means:
• Sticky inflation returning through the physical cost of living
• Central banks trapped between rising prices and soaring debt costs
• Accelerating capital rotation out of paper assets into real ones
The paper narrative of “cooling inflation” is about to collide with physical reality.
The breakout, if confirmed, changes the entire macro regime.
Physics > Paper.
True. 2021 broke out and then rolled over.
Why yields matter: back then money was still cheap. Rates then shot higher and the dollar got strong- that crushed commodities versus the S&P.
Now the US 10 year is already above 5% and Japan is at 30-year highs. That squeeze already happened. This is not the 2021 setup.
@PrognosticApex Silver/Oil doesn’t invalidate a gold structure. Different chart.
Oil can lead the ratio from a cheap base and gold still holds the arc. That’s rotation, not contradiction.
You didn’t refute the box. You changed the subject.
Red metals. Green dollar. The feed is panicking.
That is not a thesis change.
$Gold already broke the bull flag. What you’re watching now is a test of the arc — it has not been invalidated.
If we lose the underside, my base case is a fill of the imbalance I marked. The box. Not a collapse.
Miners will get punched harder. That’s normal in a bull market.
If price accepts below the box, the read is wrong. Until then: zoom out, drink the coffee.
Physics > Paper.
$NatGas hit 2.64 exactly — the level I marked.
Now it’s pressing the top of this coil. Yesterday printed a large daily demand candle. That’s usually what you want to see before the line gives.
If it breaks, the next leg starts.
Same structure as crude. Still early.
Physics > Paper.
Called the exact level.
$NatGas just bounced precisely off the 2.64 structural support I marked days ago.
The retest held cleanly.
Price is now turning higher alongside crude - exactly as the broader energy setup suggested.
Structural support + physical deficits aligning.
Still early.
Physics > Paper.
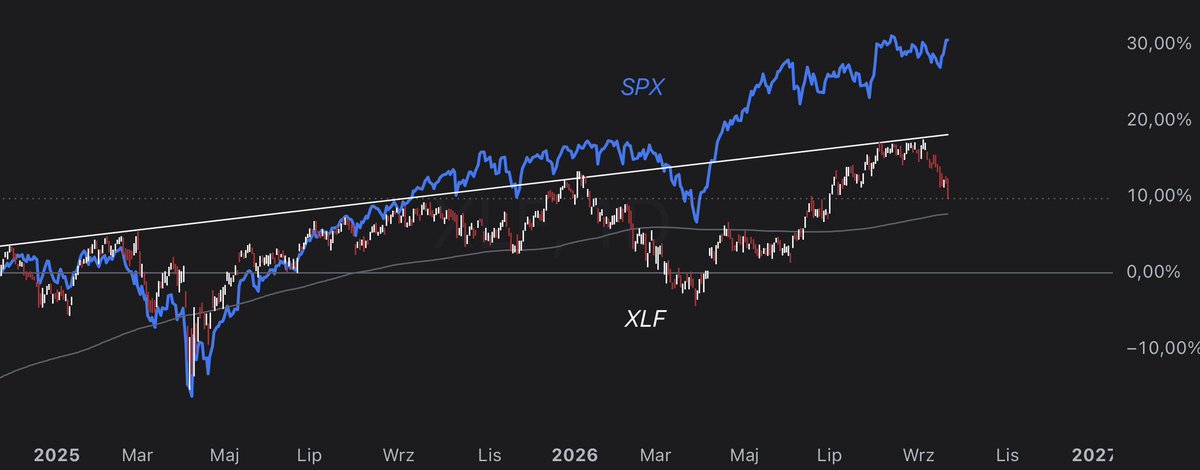
Banks are breaking. The index is not.
$XLF is rolling over hard. $SPX keeps printing highs. That gap is not noise - it’s a tape running on fewer and fewer names.
I flagged this divergence two weeks ago. Since then it only got worse.
A rally the banks refuse to join is not strength. It’s the last squeeze before the index has to answer the breadth.
I want to warn You if you’re heavy in the S&P.
The index broke out. The banks did not.
Same rising line. The blue line is $SPX - it went through. The candles are $XLF - still stuck underneath.
When the index rips and banks refuse to follow, that breakout is weak. A few names are carrying an expensive tape.
This is the squeeze I flagged.
$Nasdaq just punched through the descending trendline. Crowded shorts were the fuel - not the top.
A melt-up from here wouldn’t fix the valuation. It would just force the book to cover first.
Crowded shorts don’t usually mark the high.
They mark the squeeze. If Nasdaq wants one more run, this book is the fuel - then the index still has to live with the debt, the dollar, and expensive oil.
A last spike wouldn’t change the valuation case. It would just empty the shorts first.
XOP is the cleaner, more liquid E&P sleeve. Nothing wrong with it.
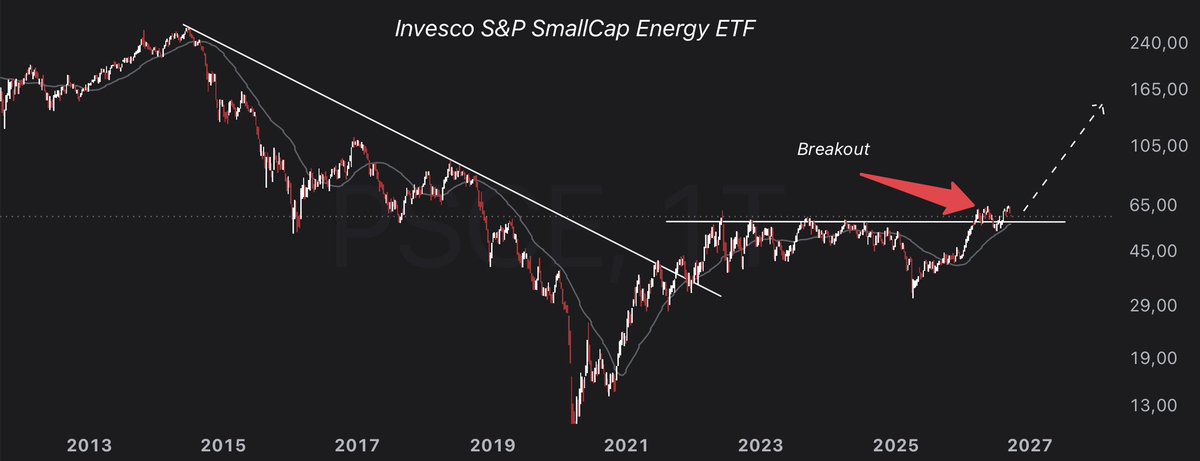
$PSCE is a different animal - S&P SmallCap energy. Smaller names, thinner tape, more torque if the rotation keeps going.
I’m not choosing one over the other. I already hold larger energy. I added $PSCE because that weekly breakout is cleaner on this sleeve.
Both can work. Different risk.
Oil is correcting. That’s the point.
If you’re using this dip to add energy, look at $PSCE - small cap energy producers.
Weekly chart: the multi-year downtrend is broken. Price coiled for years under the same horizontal. That line just gave way.
That’s a breakout, not a bounce.
I added more today. Crude can chop. The structure already voted.
I went into natural gas early. That was the point.
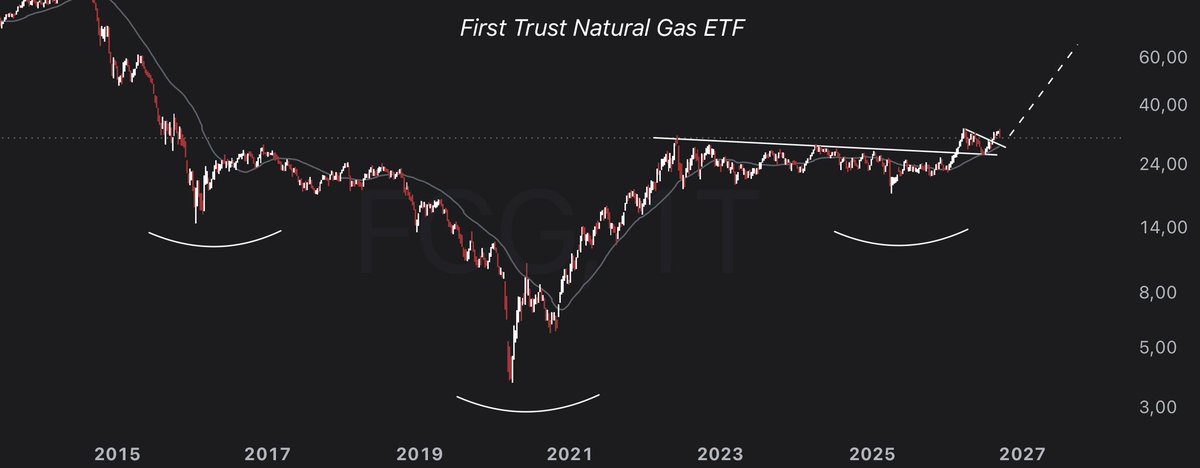
$FCG just cleared a multi-year inverse head-and-shoulders. Producers, not the futures curve.
LNG, power burn, chokepoints — the geopolitics finally matches the pattern. Crude already moved. Gas is late. That’s the asymmetry.
Same note: Brazil’s wedge retest, and oil versus M2 — the ratio that shows whether crude beats the printer.
Full maps (free): https://t.co/QmQS7yOE7a
Physics > Paper.
Lost a lot on $EQTY. Juniors often don’t deliver - that’s why you hold many, not one. I had too much in this one.
The edge isn’t being right every time. It’s not blowing up when you’re not.
If juniors are about to have a good run, diversification beats conviction. What’s your setup?
The 10-year is back at 5%.
White arrows on this monthly are crisis cuts and QE. Red arrows are inflation cycles.
1970 was the last long inflation regime. 2020 was the reset from zero — same direction, far more debt.
Yesterday’s hike didn’t create this chart. It tagged 5% on a Treasury market the size of a country. That coupon has to be rolled. Hard assets don’t need a speech after that. They need the bid that shows up when food and energy already broke their boxes.
Coupon and calorie. Same decade.
Physics > Paper.
The gold arc held.
Two days ago the only question on this tape was whether the retest failed. It didn’t. Price tagged the structure and turned — gold is +2.5% off that box.
Hawkish Fed. First-hour dump. Then the chart did what the chart was built to do.
Same map. Next test is whether this bounce sticks above the box.
Physics > Paper.
Gold still looks like a chart, not a headline.
We’re inside the arc. The bull flag already broke. This box is the retest.
Tomorrow is the Fed. That’s the only question that matters on this tape:
Does the arc hold - or does the retest fail?
@BackStCrawler That’s the tell.
A hawkish hike used to flush metals for days. This tape absorbed it and held the structure.
If the first session doesn’t break PMs, the bid underneath is not tourist money.
Hawkish Fed. Same box.
$DXY spiked on the hike - and is still trapped in the same multi-month coil around 100. That upper line did not break. Until it does, yesterday was noise inside the range, not a new dollar bull market.
Two paths from here, nothing else:
• Break above the coil → dollar strength, ugly tape for metals
• Hold and roll over → my base case: USD weakness, commodities keep the bid
Don’t treat the FOMC spike as a new trend. The range is still the range.