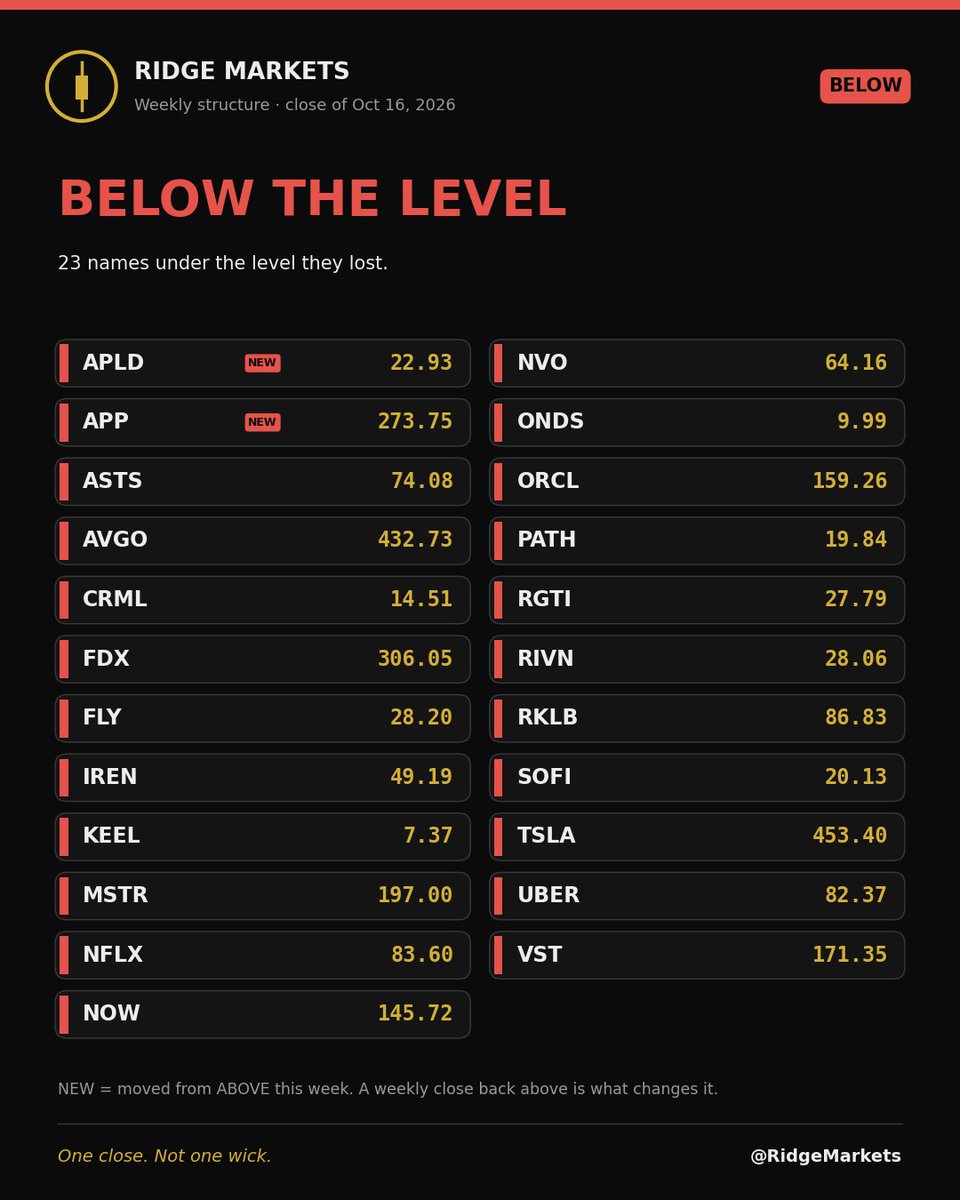
Weekly structure, October 16 close.
Above: holding the floor.
Below: under the level they lost.
Every level reads on the weekly close.
New below this week: $APP and $APLD.
@StockMKTNewz "Initial move" is the key phrase. After hours on $BE is the first vote, not the count. Where it closes Friday tells you whether earnings changed the weekly structure or just shook it.
@RedDogT3 217 and 212 are the lines for active traders. On the weekly, $NVDA's trend sits on your 190ish shelf, 189.80 on a closing basis. Until a week closes under it, this is a pullback inside the trend.
@MikeZaccardi Fresh low after a string of lower highs since the August peak. For $GE the structure turns when a weekly close reclaims that last bounce high, not when it simply stops making lows.
@enrichtrades "Attempting" is the right word. At 1113 there's no overhead supply left, so the only question is whether $LLY holds it: a weekly close above the old high makes it a breakout, a close back under makes it a test.
@ACInvestorBlog Four firms, four Buys, four targets moved. A target says where they think it's going. The weekly floor on $META says where the trend is actually wrong, and one earnings reaction rarely gets there.
@MartyChargin Up 9% straight into the top of the range that capped it all summer. That's exactly where $MANE gets hairy. Friday's close says whether it's a breakout or another rejection.
@1ChartMaster Textbook sequence on $HNGE: first breakout, pullback, higher breakout, with the 8-week guiding each step. The average trails price. That flat line at the summer highs is the floor that stays put.
@RichardMoglen Nice pop out of the wedge. If $CRCL drifts back to the top of it later, that's the retest, not a failure. A weekly close back inside the wedge is what would actually undo it.
@SpacBobby That note had EV at $23B, you're at $16B now. The spectrum value didn't move, the price did. For $ASTS the discount starts closing when it gets back above where it broke down on the weekly close.
@Mr_Derivatives Filling the gap is the first target. Holding it on the weekly close is what makes it more than a bounce: $NFLX back above the gap by Friday and the earnings drop starts to look like a shakeout.
@ACInvestorBlog Broadening wedges get decided on the close more than on the hourly. If oil loses the lower line on a weekly close, that's the break. A dip under it intraday that closes back inside is just the megaphone doing its thing.
@StockMKTNewz Capacity deals are a 2027 story. The chart's answer comes sooner: for $NVDA, Friday's weekly close shows whether the market is pricing this in now or waiting for the units to ship.
@RedDogT3 Two sessions of relative strength is a good tell. The weekly version for $QQQ is simpler: closes holding above that 702 line from September keep the structure intact.
@StockSavvyShay Distribution deals like this add revenue without adding risk, which is the kind of news that lasts beyond a day. For $SOFI the part to watch is whether it holds into the weekly close rather than fading by Friday.
@Barchart Post-market is printing near 159 after a regular close at 147.79. For $SPCX the move that counts is the one still standing at Friday's weekly close, not the one at 6pm.
@unusual_whales Revenue forecasts are the thesis, weekly closes are the scoreboard. For $SPCX the forecast moves the narrative, but only the chart shows whether buyers are paying for it week after week.
@Banana3Stocks After-hours moves on headlines are a first draft. For $NVDA the version that sticks is the weekly close: Friday shows whether this was a pop or the start of a new leg.
@scottmelker An interesting fight over where the shares trade. For holders the question is the same on any venue: whether $GS holds its last confirmed higher low on the weekly close.
@unusual_whales A September 2027 call is a bet measured in quarters, not days. The chart that matches that horizon is the weekly, and $CRWV still needs a first higher low there before the stock agrees with the trade.