If a leader is going to HOLD UP, it usually tells me right at the 9week.
After studying prior leaders...over and over again, the biggest leaders of every cycle tend to respect the 9week during healthy uptrends.
If you go back and study stocks like $ARM, $MU, $SNDK, or countless other recent market leaders, you'll notice something very, very interesting... after breaking out of large bases, they rarely move in a straight line. Instead, they advance, digest, pull back into support, find buyers, and then continue higher.
More often than not, that support area ends up being somewhere around the 9week.
That's why I pay so much attention to this area on leading names. The 9week is where I start asking questions:
"Is this just normal profit taking?" or...
"Is institutional demand beginning to disappear?"
I do believe both questions answer different concepts.
I've picked up that the majority of traders on X see a pullback and immediately assume something is wrong, but I often see PBs as an opportunity. If a stock has already proven itself as a leader, is part of a strong theme/group, and has been outperforming the market for weeks or months, a pullback into the 9week is usually the first place I become interested again an a range move. But here's the catch...
I don't blindly buy the 9week.
I STALK the reaction.
Think about the psychology of buyers + sellers... after a strong run, people begin taking profits. Short-term traders get nervous, weak hands start selling, and the stock pulls back into an area where institutions have previously supported price.
Now the question becomes:
"Do buyers show up again?"
Simply put...that's what I'm watching.
If a stock slices through the 9week with heavy selling pressure and can't reclaim it, I take note. If sellers push it into the 9week and buyers immediately begin defending the area, that makes my eyebrows perk.
The REACTION matters MORE to me than the level itself.
This is where my lower timeframe execution comes into play. Once a leading stock reaches the 9week, I immediately move down to the 15 + 30min TF. I'm looking for evidence that momentum is beginning to shift.
Things like...
> Undercuts and reclaims
> 15/30 min bullish pivots
> Intraday VWAP reclaims
> Higher TF failed breakdowns
> Higher lows starting to form
> Buyers defending weekly support
These are all clues that selling pressure may be exhausting itself.
My favorite entries usually come when sellers flush price below an obvious level, trap late sellers, and then buyers step in aggressively to reclaim it. Once a 15 or 30min pivot forms, I can enter with a tight stop underneath the low and/or LOD.
That's what creates the asymmetric opportunity.
I'm not trying to buy because the stock is down. I'm buying because buyers are proving they're willing to defend an area (I'm watching) that already matters on the weekly chart.
Something I've learned from studying hundreds of market leaders is that the best stocks often make it difficult to get in. They like to shake people out and create doubt. They pull back just enough to make people question the trend before continuing higher.
IMO, the 9week is often where that battle takes place.
Here's a SIMPLE process to backtest yourself:
1) Identify a leading stock with strong RS.
2) Wait for a PB into the 9week/50EMA confluence.
3) Monitor volume + price behavior around support.
4) Drop down to the 15/30min charts.
5) Wait for buyers to prove they're stepping in.
6) Enter on a pivot high + support reclaim.
7) Risk against the low and/or LOD.
Don't just take my words as truth... give it a try yourself!
This is the focus: to put myself in a position where risk is small, the trend is still intact, and institutions are potentially showing their hand again.
That's why I love the 9week, and again it's not an entry signal by itself. It's an area of interest where some of the best "low-risk" opportunities in leading stocks tend to develop.
I write all of this to say, watch the 9week!
Charts: $INTC, $AMKR, $AEVA, $OUST.
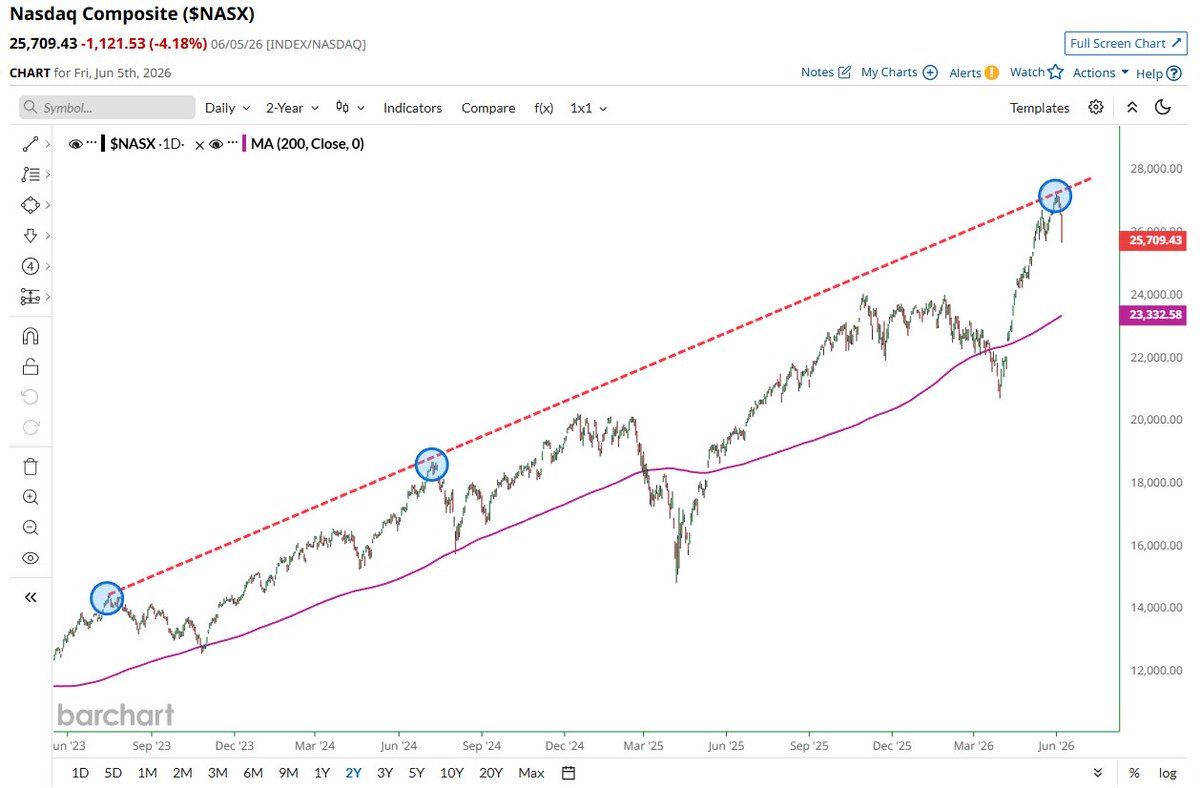
Nasdaq with a textbook rejection off the 3-year trendline 🚨🚨 Each of the prior rejections led to an eventual drop all the way down to the 200-day moving average 📉📉
This is a really interesting paper about stock performance.
If you bought $AMD at the close every day and sold at the open the next day, over decades you’d have gotten a whopping +4,555,517% return.
But if you bought at the open every day and sold at the close the same day, you’d have lost almost everything – down -99.94%.
This pattern holds across every major market globally. This just reiterates that time IN the market beats anything else.
Other examples:
$MU: overnight +138,330,342% – intraday -99.92%
$NVDA: overnight +221,715% – intraday -99.7%
Same stocks. Completely opposite outcomes depending on when you hold it, overnight risk premium pays, intra day trading doesn’t.
To all my amazing followers. NOBODY teaches you this. But I am right now.
THIS is how you BUY stocks at all-time highs (the right way):
Phase 1
1. The concept is called, "micro-positioning." Instead of lump-summing big and praying markets keep going up, you buy slowly, every single day.
Day 1: $500; Day 2: another $500; Day 3: another $500, etc.
2. This gets rid of the TIMING risk. Rain or shine, you keep building your positions. MUCH better and peace of mind.
3. Having FEW tickers and "conviction" works at LOWS. It does NOT work at all-time highs. Very dangerous to bet your net worth into a few tickers at all-time highs.
Phase 2:
1. Instead of "conviction", you spread your bets across many tickers and stocks. This is NOT diversification. This is, "INTENTION."
2. "Intention" is having 3 categories -> Current winners + laggards + defensives at all-time highs.
3. You will buy across these 3 buckets. Current winners are AI - higher volatility and growth. Laggards are sectors finding a low, like software, healthcare, military defensive. Defensives are consumer defense like utilities and consumer staples.
Phase 3:
1. If the markets keep going up, great. Your AI portfolio and late-stage laggards will outperform the markets.
2. If the markets go DOWN, great. Your portfolio is STABLE with defensive names and you ABSORB the volatility.
Phase 4:
1. Once the markets are at BETTER levels and have dropped, this is when you consolidate into lesser positions and have CONVICTION into fewer names.
2. You start rebalancing by keeping the winners, cutting the losers, and ride the new bull cycle into millions.
Never EVER have "conviction" at all-time highs with bearish divergence and markets stretched 3X standard deviation away from its moving averages. You WILL get humbled.
$TSLA Update.
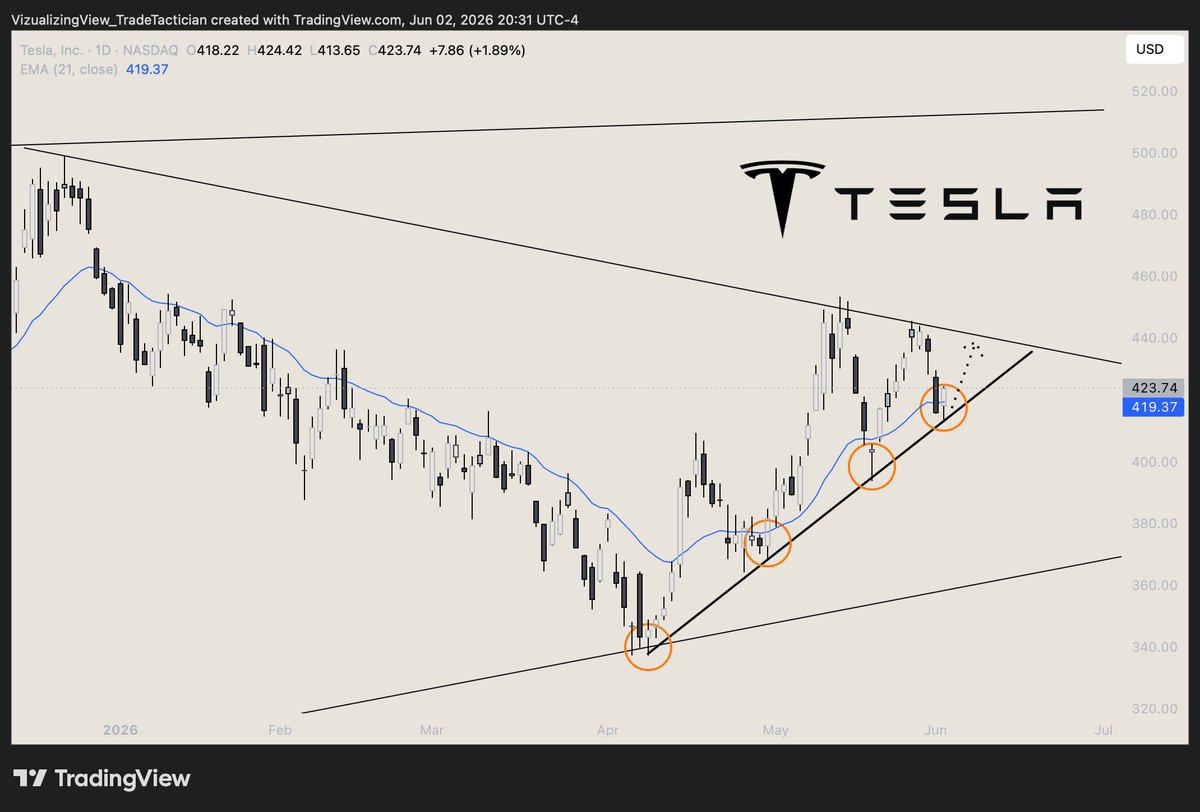
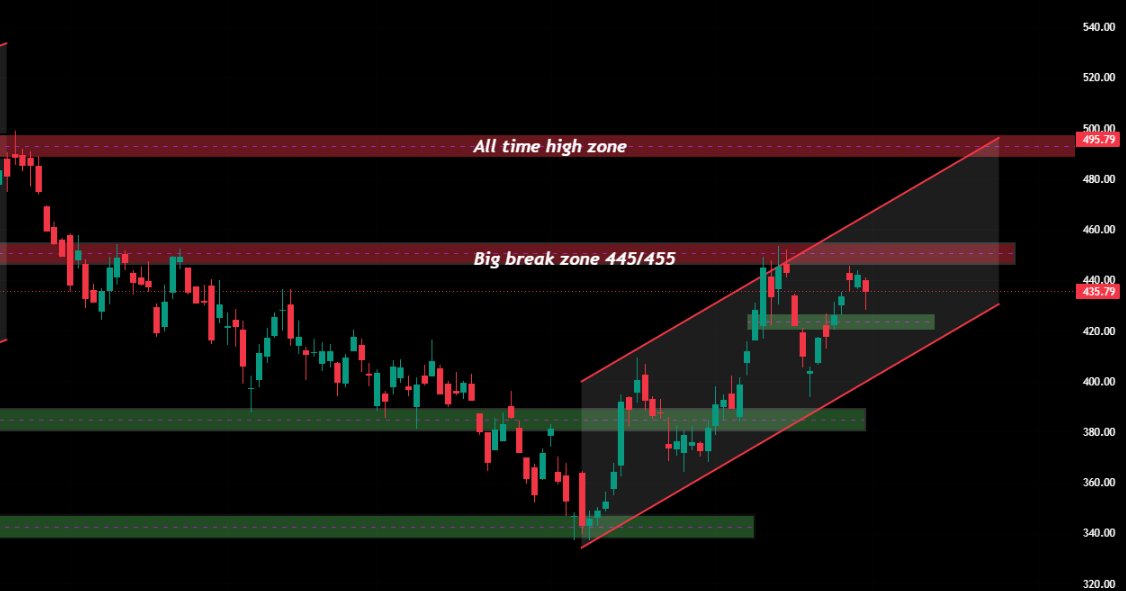
Been mentioning 445/455 as the big level for a while now tested it again and got rejected. Same zone, same story.
But here's what I liked this time look at that wick at 420. Buyers came in hard and defended that zone. That's not weakness, that's conviction. Every time this thing dips, buyers are stepping in at higher levels.
As long as 420 holds, 445/455 will eventually break. Just a matter of time.
$PLTR had a filthy breakout last week and I’m still betting the real move is just getting started.
After looking at the monthly chart it’s clear to me that $PLTR was quietly building one of the cleanest monthly J-hooks I’ve seen.
Strong advance → controlled pullback → rounded base → now seeing the trend continuation.
Under the hood, the consolidation also carved out an inverse head & shoulders pattern as buyers repeatedly defended the $125-$130 area.