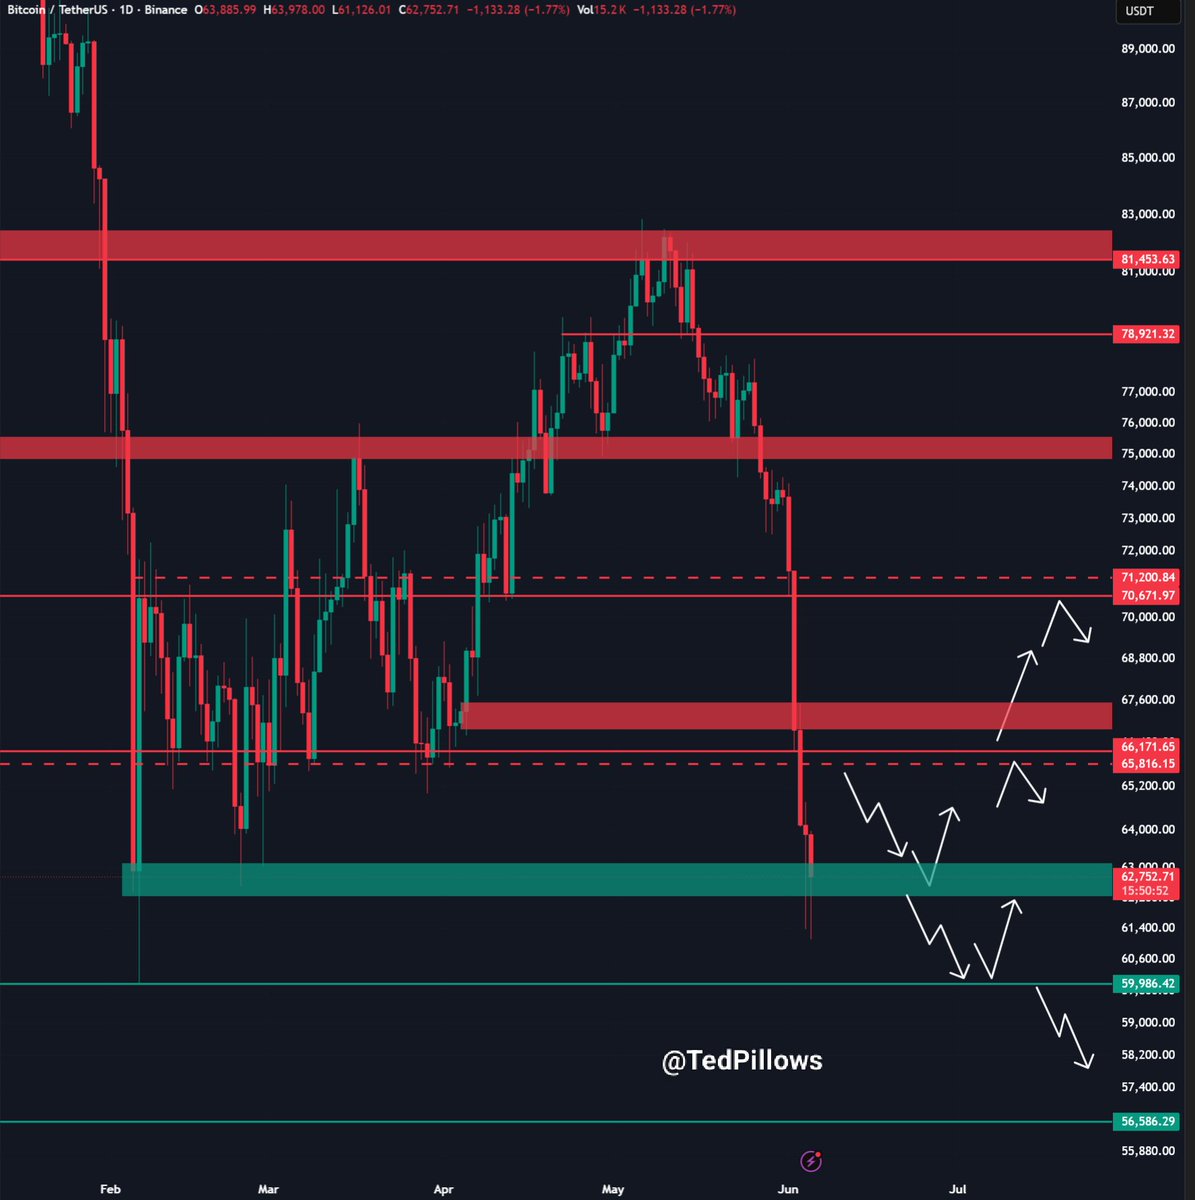
$BTC dropped to $61,000 again.
Sellers are in full control, and they are trying to push Bitcoin below $60,000.
Once that happens, we will see the full capitulation.
🚨 MY 2026 $BTC MARKET PREDICTION:
JUN → Sweep of $60k
JUL → $53k + Bear Trap
AUG → Rally to $65k-$68k
SEP → Bottom at $46k
OCT → Recovery starts
NOV → Rally to $85k+
DEC → Push to $100k
It's important to understand that bear market is still ongoing and cycle bottom has not been set yet...
I was one of few who accurately called 2025 ATH and major drop to $60k
Turn on notifications so you don't miss next call...
$BTC VS NASDAQ (QQQ) JUST HIT THE MOST OVERSOLD LEVEL IN HISTORY. 🚨
Monthly RSI at 34.
Lower than 2018. Lower than COVID. Lower than FTX.
And the ratio is sitting right on its 9-year support line.
This is extremely important support for Bitcoin.
🚨 THE MOST POWERFUL BOTTOMING SIGNAL IN $BTC IS ABOUT TO PRINT ON THE WEEKLY!!!
Bullish RSI divergence. Price will make lower lows, RSI refuses to follow.
It's the same exact setup that fired in late 2022. From that signal, $BTC rallied +713% over the following 3 years.
History doesn't repeat. But it sure rhymes.
The bottom is a process. This is the first step.
🩸 WARNING: $BTC JUST BROKE THE MOST IMPORTANT LINE IN ITS HISTORY.
14 years of support. Gone.
That trendline survived Mt. Gox. 2018. COVID. FTX.
It just failed.
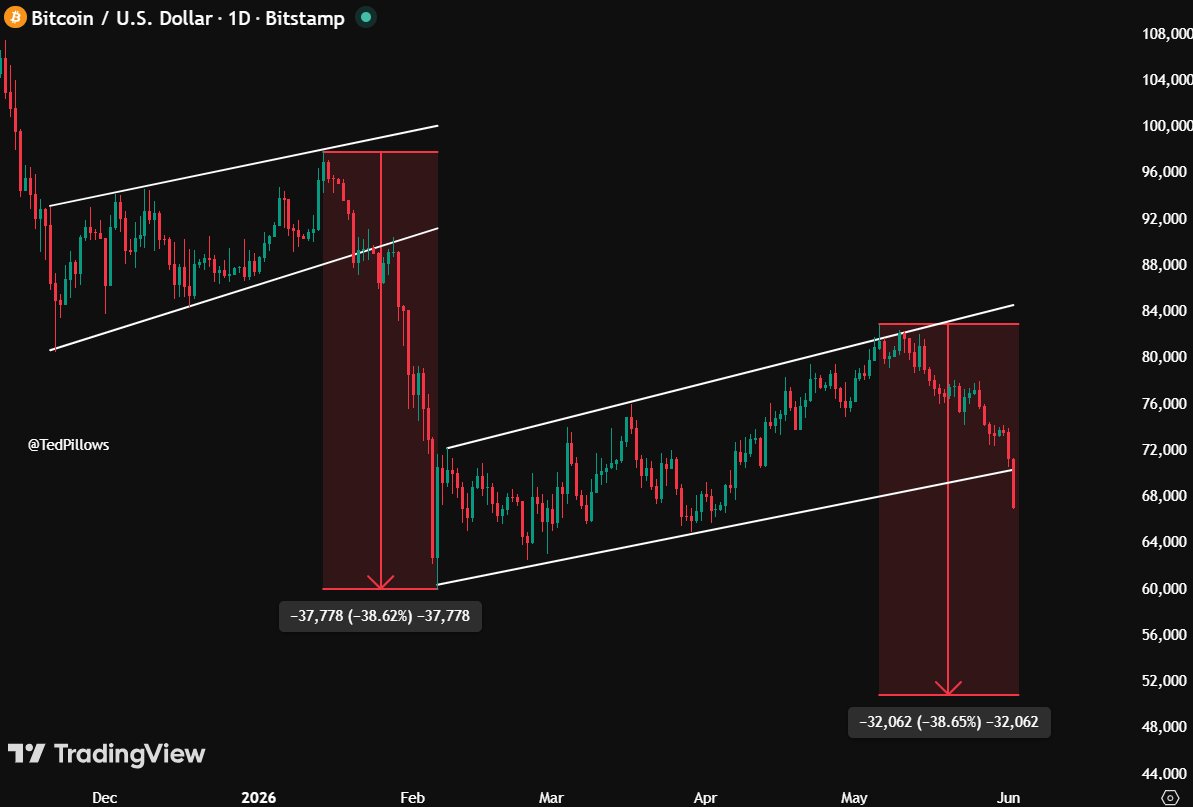
🩸 WARNING: $BTC just printed a textbook bearish flag on the daily.
A bearish flag forms when price consolidates upward inside a parallel channel after a sharp drop, then breaks down to continue the move.
The pattern is one of the most reliable continuation signals in technical analysis.
Last time $BTC printed this structure?
The February flush from $90K to $60K.
Are you positioned?
🩸WARNING: $USDT market cap just dropped $1.2 BILLION in 24 hours.
Tether only burns tokens when real dollars leave the system.
Last time we saw this kind of outflow?
Right before $BTC flushed from $90K to $60K in February.
Waren Buffett hat 100% seiner VISA und Mastercard Aktien verkauft.
Berkshire hält nun knapp $400 Milliarden USD Cash. Die größte Cash-Position jemals.
Sie setzen auf einen Einbruch des Konsums und der Kaufkraft der “Normalbevölkerung”…
Bitcoin handelt gerade auf einem Niveau, das historisch fast immer falsch war, denn er steht massiv unter seiner globalen Liquiditäts-Fair-Value.
Wenn die BTC/Liquiditäts-Beziehung noch intakt ist, dann wird BTC gerade komplett falsch gepreist.
Ein Z-Score nahe -2 gab es historisch noch nie und deutet auf den Punkt der maximaler Fehlbewertung hin.
Die Ironie: Die meisten sind bearish, weil der Preis schwach aussieht, dabei ist genau das typisch für Phasen kurz vor aggressiven Repricings.
Entweder ist das erste Mal in der Geschichte die BTC/Liquiditäts-Beziehung dauerhaft gebrochen, oder Bitcoin ist historisch maximal unterbewertet.
Interessant ist nicht der aktuelle Preis.
Interessant ist die Größe der Fehlbewertung, falls das Modell weiter gilt.
Schreib mir gerne deine Meinung in die Kommentare und interagiere mit dem Post, wenn du ihn interessant fandest, Danke! 🫶🏽
Bitcoin "Electrical Cost" is currently around $46,000.
Historically, $BTC has bottomed 10%-20% within this cost.
Based on this, the bottom could be around $52,000-$53,000.