Some of you dummies can’t help but make any issue no matter what about race huh? You support someone, it’s race related. You don’t support someone, it’s race related. The stupidity of a lot of you has zero bottom. It’s amazing. But then again, it isn’t. It’s 2026.
“It was my fault”- @JaredVerse1@Rams pro bowler Jared Verse takes the blame for their loss to the Seattle @seahawks. He says a young defense felt a sense of entitlement as the headed into the NFC Championship. Matt Stafford and the offense were everything they needed to be, but the defense didn’t respond emphatically enough when Seattle drew first blood. This one will sting for a while.
@Thepivot on @youtube & all streaming platforms.
#ThePivot #LosAngelesRams #JaredVerse #NFL #Podcasts
https://t.co/vq7mbiRFGW
I think 1984 was probably the best year ever for movies.
Footloose, The Karate Kid, The Never Ending Story, Sixteen Candles, Ghostbusters, Terminator, Indiana Jones Temple of Doom, Gremlins, Beverly Hills Cop, The Last Starfighter, Nightmare on Elm Street, Red Dawn ... epic year
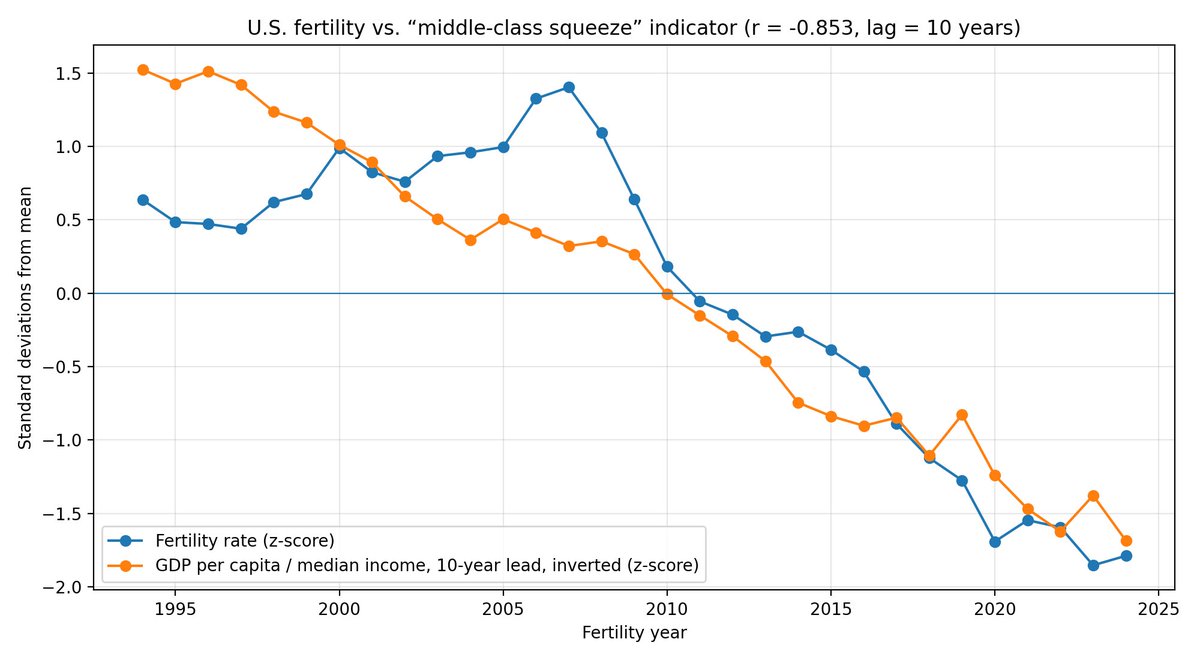
I took the first chart on fertility rate and then asked the following:
“Run a Monte Carlo simulation where you overlay various economic indicators on this chart of fertility. For example, GDP, GINI, cost of housing, middle class income growth etc. find the economic indicator that has the highest correlation to the chart provided. There may be a lag effect where the chart is the byproduct of some economic event so consider this lag in your correlation analysis.”
Result: the strongest match was not GDP, Gini, or housing alone. It was a derived “middle-class squeeze” indicator: real GDP per capita ÷ real median household income, with the indicator leading fertility by 10 years. The correlation was r = -0.853 over the 1994–2024 fertility window. Interpreted plainly: when output per person rose faster than median household income, fertility tended to be lower roughly a decade later.