Trading service of Trader Ted. Weekly trading setups for stocks, indices, crypto and commodities. Based on price action and: Supply- & Demandzones and Cycles!
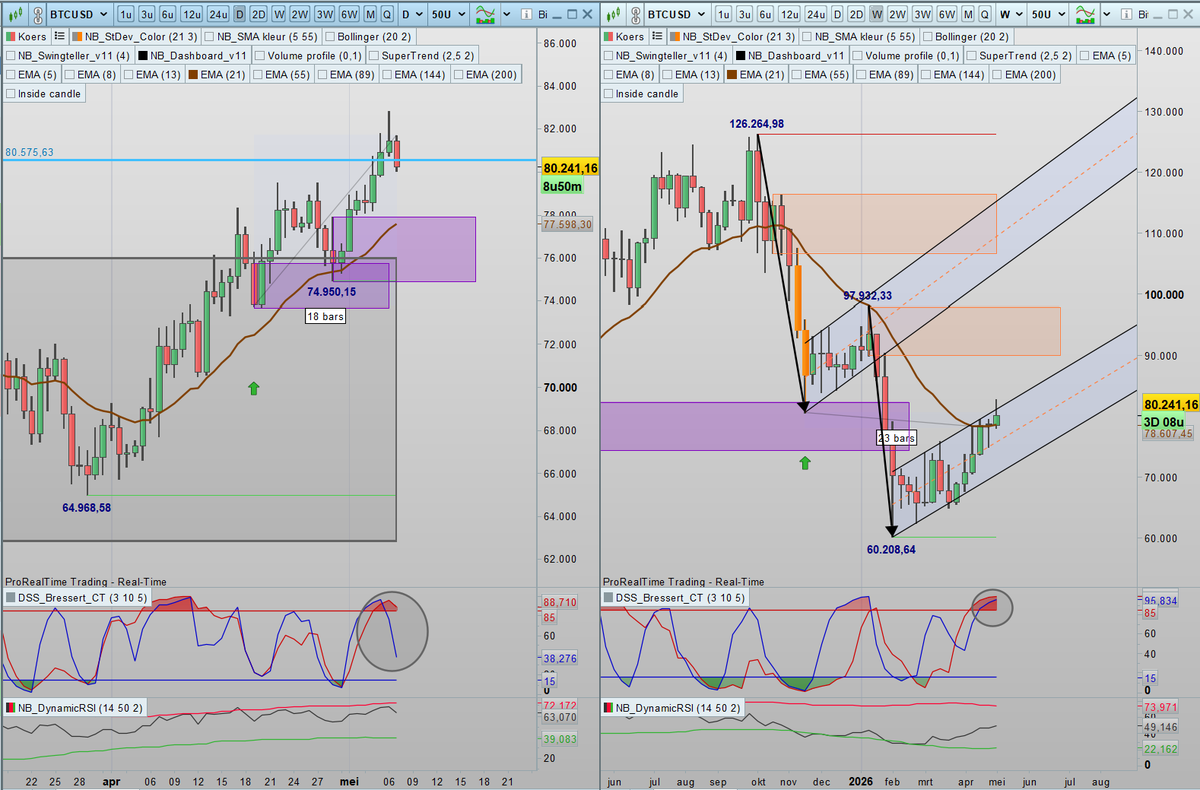
$BTC $BTCUSD At May 7th - 1 day after the local top - I mentioned the topping tail bar and the possible bear flag. Bitcoin was trading above 80K, just above the MA21.
I mentioned as well that "if it breaks down the brown line, buckle up"! Well, I think that view played out to the tick! 🎯✅
Bitcoin already broke below the early 2026 lows and the indicators are suggesting the bottom shouldn't be in yet.
Who else provided you this view in advance?
$BTCUSD As said, a pullback seemed to be around the corner. I mentioned the wicks above the candles, today a red candle being formed that broke yesterday's lows. On the weekly still above the MA21, but a topping tailbar just above the rising channel (bear flag?) could be produced. If it break down the brown line, buckle up!
😂 Trump needs to calm the markets! Can't he even handle a 5% pullback?
I'm expecting a tweet any moment now: "A deal could be reached within hours." Then we'll spend the next few weeks waiting for something that never materializes.
Feels a lot like the Iran conflict playbook all over again.
BREAKING: President Trump says the Trump Administration might buy equity stakes in US AI companies and that he will host a meeting with AI executives as soon as next week, per Reuters.
En... klaar! ✅
Morgenochtend rond 11:00 uur ontvangen de abonnees de nieuwste editie met o.a $ASRNL $AAPL $COIN $ETH en $ES de S&P500 futures, in totaal liefst 30 pagina's!
📈 Uitgebreide technische analyses
📊 Standaard de dag- en weekgrafiek
🔍 Waar relevant ook de maandgrafiek
📉 En soms zelfs de kwartaal- en halfjaargrafiek
🎯 Inclusief concrete trading setups
Nog geen abonnee? Profiteer alleen dit weekend van liefst 35% korting en ontvang direct de meest recente editie in je mailbox!
✔ Opzegbaar wanneer je wilt
✔ 14 dagen niet tevreden = geld terug
✔ Beschikbaar in het Nederlands én Engels
👇 Meld je hier aan:
https://t.co/lQlso9y7JZ
$BTCUSD Bitcoin is approaching a level that's getting my attention....
I've just updated my long-term outlook using the monthly and quarterly charts, complete with a ready-to-use trading setup and key levels to watch. The report also covers
$NQ Nasdaq100 Futures
$AAPL Apple
$XAUUSD Spot Gold
Available in both English 🇬🇧 and Dutch 🇳🇱 for just €4.99. 👇
https://t.co/jwHhXau32b
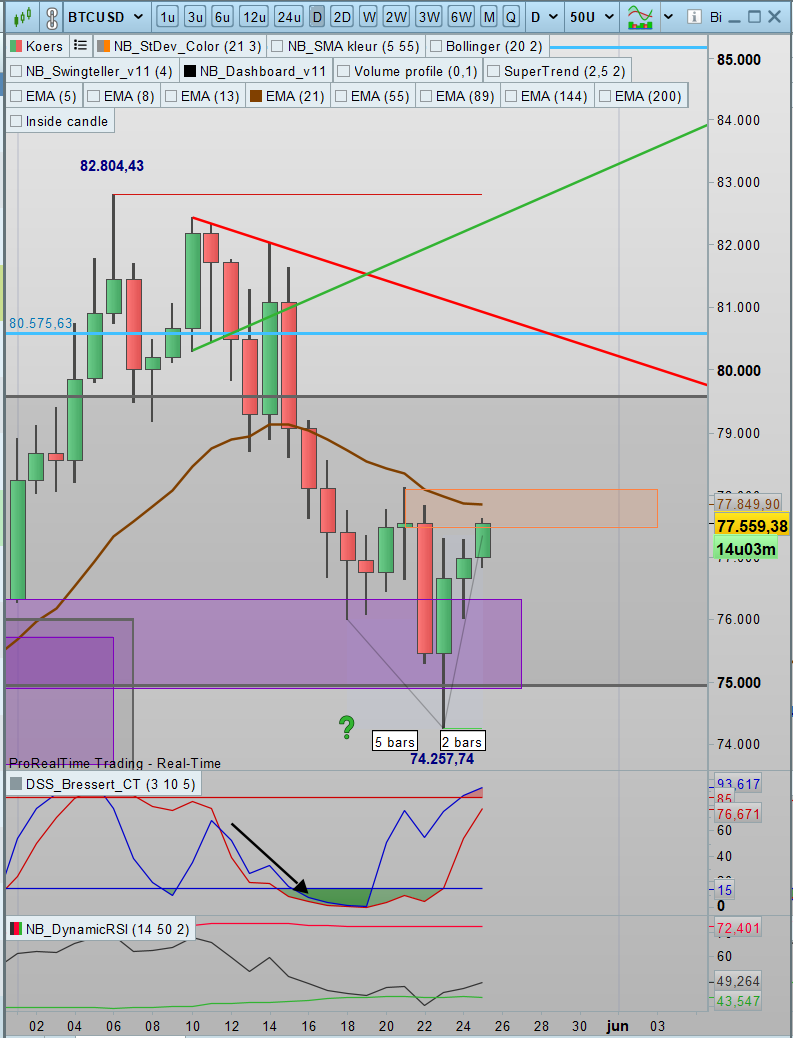
$BTCUSD I wrote this, at May 25th when Bitcoin traded around 77.5K:
"As mentioned before, the line in sand is 78,128! Close, but till proven otherwise it's an important resistance level".
That level WAS important! Now down to 60ishK and heavily testing the February 2026 lows!
All given for free, in advance.
$BTCUSD Bitcoin is entering the daily supplyzone, from where the drop to set new local lows started. Bulls need to break this zone and the flattening brown MA21 to confirm Saturday's low was the daily cycle bottom.
The scenario that the bottom had been set earlier and that the new cycle is bearish, is still not invalidated! As mentioned before, the line in sand is 78,128! Close, but till proven otherwise it's an important resistance level.
$VIX Friday VIX wiped out around 40 days of price action. Although many people are saying that volatility needs to be crushed early next week, the chart is telling me something different...
Friday's candle closed at the highs, so buyers are in firm control. The open gap down will act as magnet and the orange supplyzone - where the imbalance started - could be visited first. Indicators are suggesting the positive momentum can extend a bit, so I don't see a reason why you should buy this big market pullback right now.
Once VIX is reaching the supplyzone and crosses the 25 level, I would be cautious if you're still short at that moment.
On the other hand, markets can rally multi-day on no news or some Trump tweets (by the way, a few weeks ago the markets rallied based on the news that the Iran conflict would end in several hours....), so why not a multi-day correction?
@Yazd2045 I expect a bottom soon, and a decent bounce to come. It's not the spot to search for a down move anymore, although Bitcoin can easily drop 10K more. The risk-reward is in favour for longs at these levels.
$VIX Although the VIX surged nearly 40% on Friday, it still closed at just 21. That's hardly a level associated with fear or panic.
Statistically, when the VIX rises by 20% or more in a single day, the odds strongly favor a market rebound in the days that follow. However, given the relatively low absolute VIX level, this time could be different. In other words, the statistics that have supported buying recent sell-offs may not be on your side this time....
For people who are worried about the market today, I get it. This stuff is very stressful.
So I put together a chart of all of the times the VIX (the "fear index" of the market) was up over 30% in a day (like today) in the past ten years.
23 out of 25 instances the market was higher one month later. The only two times it wasn't was Feb 2020 when Covid hit the economy in March 2020.
What is the underlying message? When people are afraid, they make bad decisions. Do the opposite.
Attached is a chart summarizing my results.
Finishing up my latest report! Tomorrow, subscribers will receive:
✅ In-depth market analysis
✅ Ready-to-trade setups
✅ High-potential stock and crypto opportunities
$ES $AAPL $ASRNL $CHTR $COIN $ETH $ETHUSD $SG
Last week, we stayed on the right side of the market and closed with strong gains. 📈
🚨You can subscribe today with an exclusive 35% discount — simply click the link below and the discount will be applied automatically. Reports are available in both Dutch and English.
👇 Join here:
https://t.co/lQlso9y7JZ
$SPX - This was the biggest down day of 2026. It closed below the 20 day MA so the next downside target is the lower BB which is less than 1% lower. If it breaks the May 19 low(7334) the status of the market's action will change from a pullback into a correction.
$NQ Non-stop selling today! Even a tweet of Trump couldn't turn this around. Broke down the rising channel and is wiping out some weeks of price action in 1 single bar. Can't remember when a -4.5% happened before.
Buyers might step in in this purple demandzone.
By the way, I posted this to my premium members, only 50 points before the high....
$SOX Madness! Rallied 26% in the last 10 sessions, so over 2.5% up on average, for 10 days in a row! But that happened after a small pullback after a even more impressive run of +71%!
Only a few hundred points left and SOX has doubled (!) in just over 2 months!
$AVGO OK, trend was clearly up since the bottom of end of March and it based at a high level till end of May. But normally you don't see a breakout just before the earnings release, which is being scheduled tomorrow after the close.
Or earnings have leaked, or FOMO traders have lost there minds and are gambling on a beat or a rise of the outlook.
Curious to see if they will be slaughtered or be lucky this time. Yes, it always can go up more, but longing here, at the extension of the original base is suicide! Stoploss should be below the Mid April low, let's say the MA21. So you have $70 risk (SL at 420) so with a 2:1 ratio your target is $630! Let it put it differently: there is no long setup right now!
I don't have any direct position in Broadcom, but I definitely won't chase her!
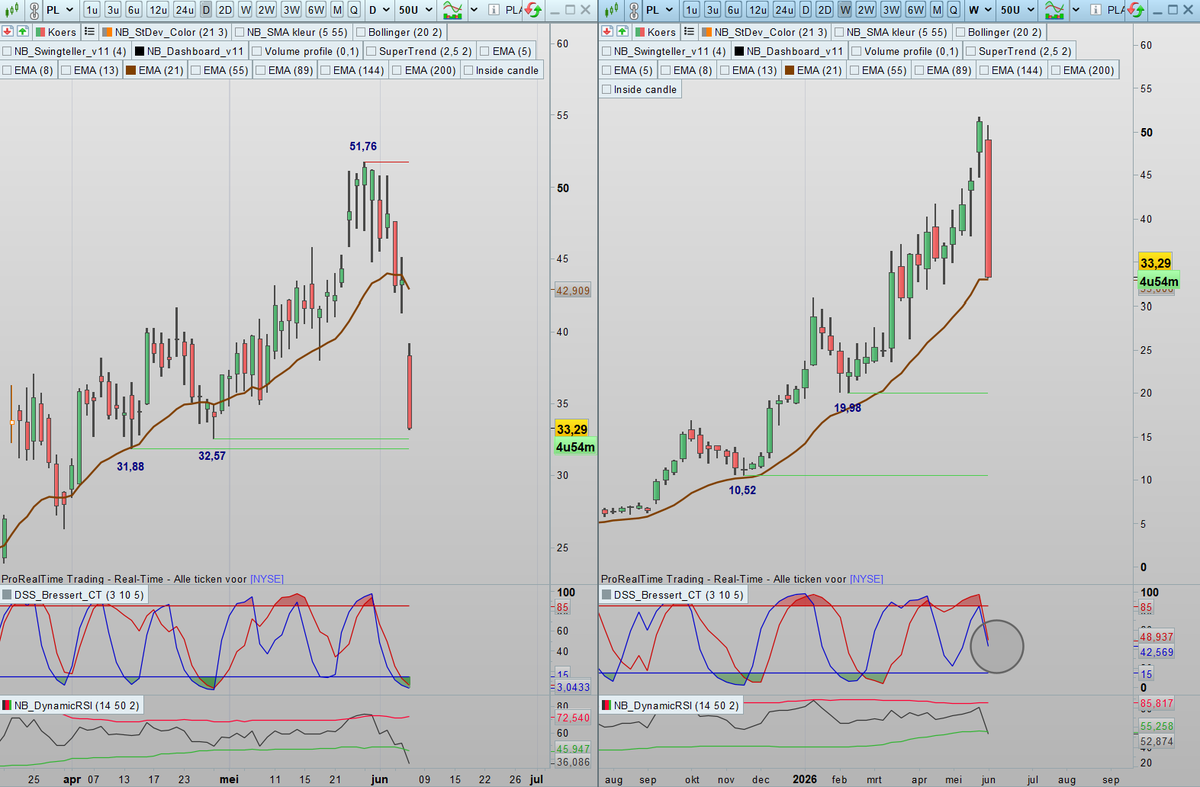
$PL What. A. Sell-off! Right at the weekly MA21, where one should expect support. Daily indicators seems setting up for a bounce early next week. But weekly indicators suggesting that bounce should become a dead cat bounce and that the lows aren't in....