@outbreakupdates This graph is not officially published by WHO. There are no such cases in st Helena if you follow the original WHO DON 8th May full report which this pic claims to source from. This graph is created by a so called Cheng yi lee ..
@AmeshAA@hfbjg53287314 These 2 were on the same cruise ship and the same flight from St Henela to Johannesburg with the dutch woman who died at the airport and tested positive after her death. So you think they don't need to be quarantined upon return to SG while still within incubation period?
The Fibonacci extensions 1.272, 1.454, and 1.618 levels play a crucial role in my technical approach, not only for
identifying levels in price discovery, but also on intra-swing setups.
Why?
Because they often align with deeper principles of market structure and smart money concepts.
These levels aren’t just arbitrary numerical target, they reflect how price behaves around liquidity zones and institutional activity.
In the "realm" of smart money trading, where the focus is on understanding how institutions operate Fibonacci extensions provide a high-probability confluence when identifying where price is likely to react or reverse.
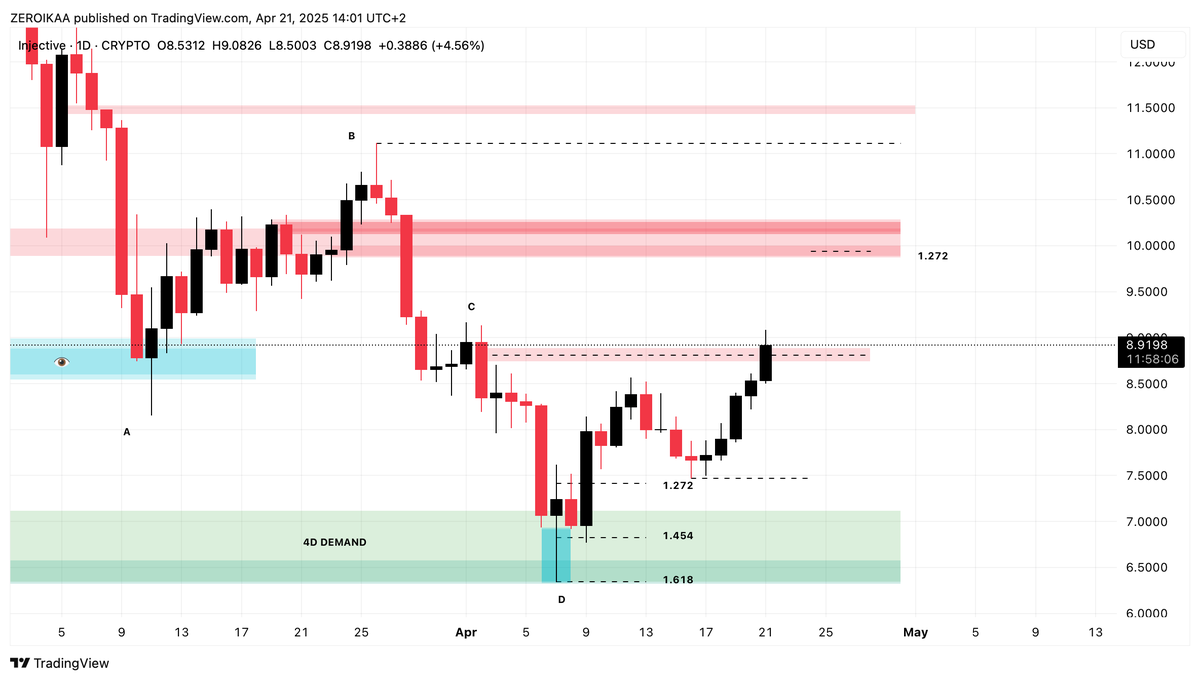
As you can see from the INJ example I posted, when we draw an extension from a significant internal or external swing say from point A to B in a corrective leg or impulsive move, we're essentially mapping out where smart money may be targeting liquidity or where their orders might be getting filled.
Let’s consider the 1.272 level first.
This extension is often where price experiences the first meaningful reaction after breaking structure or liquidity.
Institutions often initiate partial profit-taking or reaccumulation phases at this level.
Why?
Because after a sweep or a displacement, price typically stretches to clear immediate internal liquidity pools.
The 1.272 is a "sweet spot" where price has extended enough to move beyond obvious retail stop levels but hasn't yet hit the deep premium/discount levels where large reversals are usually triggered.
The 1.454 extension, (not known from masses) is highly respected in smart money frameworks because it often aligns with inefficiencies or unmitigated order blocks on higher timeframes.
When you're trading intra swing, the fractal nature of price becomes incredibly apparent, meaning that these levels on LTF often coincide with larger, more meaningful zones on HTF.
The 1.454 is where price is often in a kind of "no man's land" between partial institutional exits and final liquidity grabs.
As such, it becomes a prime area to either watch for confirmation to continue the trend or prepare for a reversal.
Now, the 1.618 is arguably the most powerful of the 3.
Often called the "golden extension," this level frequently marks the climax of a move, a final push engineered by smart money to trap late entrants and engineer liquidity for the next leg in the opposite direction.
It's no coincidence that the 1.618 aligns with high-volume nodes or previous zones of imbalance when backtested.
In a distribution or accumulation schematic, this is where you'll often see evidence of a UTAD or Spring, depending on context.
Price reaches here not simply by chance, but by the careful design of algorithms and institutional flows that aim to absorb liquidity and rebalance their positions.
In the chart I shared, this behavior is clearly illustrated.
The Fib extension drawn from A to B aligns incredibly well with the 4D demand zone.
This is more than a coincidence.
Price reacting to the 1.618 extension from the prior swing validates the idea that even intra-swing moves are not isolated from HTF logic.
This demand zone reflects a combination of unfilled institutional orders and a prior imbalance, and the fact that it aligns with the 1.618 only amplifies its significance.
This is also why I don’t solely rely on horizontal supply and demand zones or OBs in isolation.
When you couple those smart money concepts with Fib extensions, particularly these three, 1.272, 1.454, 1.618, you’re effectively stacking confluences that give you both the why and the where of price behavior.
They help you anticipate not just where price might go, but also why it might stop there, because that's where institutions are engineering or rebalancing positions.
Even within intra-swing contexts, like the current move from the 4D demand to the high 8s/low 9s. these Fib extensions map out internal liquidity hunts, retracements to mitigate LTF imbalances, and zones where aggressive orders are likely to be executed.
Whether I’m managing a long position from a bullish order block or looking to short from a major inefficiency within a premium zone, these extension levels guide my target setting and risk management with often surgical precision.
So, in essence, I use the 1.272 + 1.454 + 1.618 extensions because they provide a mathematically sound, psychologically reinforced, and liquidity-aware framework for price projection.
They don’t just predict movement, they anticipate intention.
And when paired with smart money principles they become powerful tools.
Smart money are quietly setting the stage for a massive market shake-up, positioning themselves while the rest of the world remains distracted.
The signs are there for those who know where to look: unusual options activity, shadowy accumulation in beaten-down sectors, and aggressive shorting of overvalued assets.
It’s the calm before the storm, a deceptive quiet where the biggest players are loading their weapons before unleashing chaos.
But this isn’t just about market cycles or corporate profit-taking.
There are deeper forces at play, and those who control the levers of power aren’t just betting on economic downturns, they’re engineering them.
"What do you mean, mate?"
Take the sudden surge in defensive assets.
Gold has been climbing despite a supposed risk-on environment.
Bonds, too have seen inflows that contradict the prevailing “higher for longer” interest rate narrative.
These aren’t moves retail traders make out of nowhere, this is the work of institutions hedging against a known, but unspoken, event.
Is it an orchestrated banking crisis?
A global liquidity freeze?
Or something even more insidious, like a deliberate economic reset designed to usher in a new financial system?
Then there’s the derivatives market.
Hidden within the noise are massive bets on volatility, positioning that suggests insiders are preparing for a shock event.
Just like before past crashes, deep out of the money puts are being scooped up in quantities that don’t match the surface-level sentiment of the market.
It’s reminiscent of how some funds quietly positioned themselves ahead of 2008, betting against mortgage-backed securities while the media was still pushing the “housing is fine” narrative.
But this time, the stakes are even higher..are we looking at the collapse of the petrodollar?
The introduction of a CBDCs to replace fiat?
Crypto isn’t immune either.
Whales are offloading just enough to suppress prices but not enough to trigger panic, yet.
Sudden flash crashes followed by quick recoveries hint at liquidity tests, where the big players gauge how much force is needed to break key levels.
These aren’t random fluctuations; they’re calculated stress tests designed to ensure that when the real move comes, there’s no escape for the average investor.
Could this be coordinated with upcoming regulatory crackdowns?
Or is it part of a larger plan to wipe out decentralized finance and make way for government-controlled digital currencies?
There are billions in unbacked stablecoins floating through the crypto ecosystem, acting as the glue that holds everything together.
If they implode, it won’t just tank crypto, it could create contagion that spills into traditional markets.
And the smart money knows it.
Meanwhile, retail traders continue to chase AI stocks and meme plays, blissfully unaware that they’re the exit liquidity.
The same funds that pushed the AI boom are already pulling back, unloading shares into strength while maintaining the illusion of demand.
By the time the reality of slowing growth and rising costs hits, it will be too late for those still clinging to the hype.
Could this be a repeat of the dot-com crash, or is it something worse like a controlled demolition to consolidate power within a few mega-cap tech firms that will serve as the AI overlords of the next decade?
If history has taught us anything, it’s that major market crashes are rarely “accidental.”
They come right on schedule, often accompanied by a convenient crisis that justifies extreme government intervention.
So what’s on the horizon?
A banking meltdown similar to 2008, but this time, the response is a global digital currency system that eliminates cash and privacy altogether.
A geopolitical shock, such as an escalation in Taiwan or the Middle East, triggering a market-wide collapse and justifying military expansion.
An energy crisis, where sudden supply chain disruptions cause oil to spike past $200, crushing economies and forcing the adoption of “green” digital rationing systems.
A cyberattack on financial infrastructure, taking down key exchanges and resetting markets in a way that benefits those who were prepared.
This isn’t a drill.
The nuke is being armed, and when it detonates, only those who read between the lines will have already taken cover.
The question isn’t if a catastrophic event will hit, the question is who benefits when it does.
And if you’re not on the right side of that equation, you’re the target.
One of the biggest challenges in trading isn’t spotting the "perfect" level, nor it's finding a good setup, it's having the courage to take it.
You’ve done the work, your levels are clean, the environment is moving into your favor.. It’s all there.
Technically speaking, this is the moment you’ve been waiting for.
But then something strange happens.
Your logic starts to blur.
Confidence gives way to doubt.
Your finger hovers over the entry button, but you can’t click.
You hesitate… and the moment slips away.
Despite a perfect setup, your mind begins its usual "business":
"What if I’m not correct?"
"What if this level doesn’t hold?"
"What if I’m walking into a trap?"
"What if I just lose, again?"
You’re no longer trading the chart, you’re trading your own emotions: fear of being wrong, of losing again, of confirming that voice in your head that says maybe you're not as good as you thought.
This is paralysis, and it’s a silent killer in trading.
It doesn’t make noise like a blown account or a huge red day.
It whispers, it delays, it erodes confidence trade by trade.
And the most frustrating part? The setup was there.
But doubt took over, disguised as “caution.”
You convince yourself you're being smart by waiting when really, you're just afraid to be wrong.
You forget that trading is never about being right.
It's about executing your edge, regardless of outcome.
No setup, no matter how perfect, can override a mind that’s terrified of uncertainty, and in trading, uncertainty is part of the job.
You cannot eliminate it, you can only train yourself to move despite it.
This paralysis doesn’t mean your strategy is broken.
It means your relationship with risk, loss, and identity needs work because behind that hesitation is a deeper fear, that being wrong somehow means you’re not good enough, that another loss is a reflection of your worth.
But you have to remember: your job is not to predict the future.
Your job is to execute what your plan tells you to do, over and over again, regardless of fear.
Sometimes, the hardest part of trading isn’t building the setup, it’s trusting yourself enough to take it.
And that trust… it isn’t built through wins.
It’s built through presence, through showing up, through taking the trade even when it terrifies you, because that’s how you teach your nervous system that discomfort isn’t danger.
That fear isn’t a signal to freeze, but an invitation to act with intention.
You don’t become a confident trader by waiting for the fear to go away, you become one by learning how to trade alongside it.
Every time you flinch and don’t enter, you reinforce the idea that fear is in control.
And every time you step in, even when your stomach’s tight and your mind’s loud, you start shifting that power back into your own hands.
But this takes honesty.
You have to get real about what you’re actually afraid of.
Because often, it’s not the trade itself. It’s the story you’ve attached to it.
The meaning you’ve loaded onto it.
“If I lose this trade, it proves I don’t know what I’m doing.”
“If I miss this move, I’m failing myself again.”
“If I keep getting it wrong, maybe I was never cut out for this.”
These are not trading thoughts, these are self-worth wounds disguised as market analysis.
The more you internalize outcomes, the more personal every tick becomes.
Instead of being a participant in a probabilistic game, you become emotionally entangled in every candle and when your identity is on the line with every trade, how could you possibly feel calm enough to act?
This is why some traders spend years “studying” without progress, not because they lack knowledge, but because they never healed the emotional baggage that sits between knowing and doing.
Trading is not just technical.
It’s deeply psychological.
And the deeper you go into this game, the more you realize that the real work isn’t in the charts but It’s in the mirror.
You have to rebuild your relationship with uncertainty with failure and with yourself.
You have to learn to see losses as part of the equation, not punishments.
You have to forgive your past mistakes, or you’ll keep replaying them.
And maybe hardest of all:
You have to stop trying to prove something every time you trade.
You don’t need to win to validate your worth.
You don’t need to be perfect to be consistent.
You just need to be aligned with your process and courageous enough to honor it.
So next time you feel that hesitation rising or thenext time your hands get shaky and your brain starts spinning, pause, take a breath and come back to your plan reminding yourself that:
You are not here to be perfect, you are here to execute.
Win or lose, confidence is built through aligned action, not flawless outcomes.
And the more you choose courage over comfort, the quieter those doubts become.
Not because they disappear, but because you’ve stopped letting them decide for you.
That’s when you become dangerous, not because you can’t lose, but because you no longer fear it.
Usually, before BTC dumps, the market doesn’t panic but goes into "align mode".
Price may look "stable", sentiment may tilt bullish, but beneath the surface, the architecture is already shifting.
One of the most telling signals comes in the form of isolated altcoin rallies.
Seemingly spontaneous, fundamentally unjustified moves with illiquid tokens ripping 100%+ while BTC chops sideways.
To the untrained eye, it looks like early altseason or a hidden gem finally getting its due but in reality, these rallies are manufactured.
They are localized liquidity events: short-term, high-intensity demand spikes engineered to serve a specific purpose: distribution.
When smart money position for a downturn, they know that exiting size through BTC can trigger slippage, spread widening, and signal panic to the overall market so instead, they rotate capital into thin altcoin markets where they can construct liquidity "windows" with precision.
Through weeks of quiet accumulation, they corner the supply.
I don't have to tell you that these tokens are chosen not for their fundamentals, but for their manipulability because they have tight order books, small communities and minimal oversight.
Once the position is built, demand is synthetically injected: exchange listings timed with press releases, Twitter hype, influencer callouts and bot-driven engagement. (Check LunarCrush)
Each piece is part of a short-term narrative scaffolded just long enough to justify a rapid price expansion.
Thin liquidity means price can be walked up with relatively small capital, and once it starts moving, the retail reflex kicks in.
Volume pours in, volatility spikes, and the bid side increases offering the liquidity that didn’t exist during accumulation.
That’s when the handoff occurs, capital extraction.
The timing is never random.
These events often cluster before significant BTC volatility and the surge of these random altcoins occur not because something is starting, but usually because something is ending.
Then BTC breaks.
Once the major leg down begins, those same alts retrace violently, liquidity disappears and retail is left exposed, holding assets that were never meant to be held but only used.
What looked like opportunity was just microstructure in motion, a constructed liquidity trap deployed before broader market contraction.
This is how smart money exit, not through panic selling, but through engineered relief rallies in the corners of the market no one is watching closely enough.
So when altcoins start to explode without reason while BTC is flat and wicking through HTF supply areas, zoom out.
It's usually a warning sign.
- Mega March Market Update -
It's March, the sun is shining, and just like nature awakens in spring, the market stirs with renewed energy, at least this is what it seems right?
But before declaring if it's officially spring time or not, there are a lot of things that must be covered and this is what we will do in this new market update.
As always, I invite you to read everything carefully because there are a lot of information, so make sure to pay attention and don't skip it becoming a "TLDR" guy.
- BTC -
Most of you are not new to the post I made here
https://t.co/hw4kbKxTJ0 about a potential macro distribution inside my favorite "Fib box" and that's what we actually saw with that 109K representing the main target and something we perfectly hit on the Bitcoin index (109.354$), representing the perfect short/TP opportunity despite all the bullishness created by Trump and the "pro-crypto" administration.
From that level we saw a big correction that pushed BTC to catch the liquidity at 88K (small bounce) ending up in an HTF BOS below 89.525$ and also below the 2M range, tapping the CME gap experiencing what, at the moment and until proven otherwise (reclaim of the 99.765$ on HTFs) it's a relief.
"Wyckoffickally" speaking, this represents a potential SOW in structure, also confirmed by the BOS that occurred and confirmed below the range.
When such things happen, they represent a further warning sign, meaning that the HTF MS is weakening as key zones are being violated, opening the doors for lower levels.
You don't know when such lower levels will come, you just had a hint that, at some point, they will, so always keep an open mind preserving a portion of capital in order to exploit them.
Back to the HTF MS, if we reclaim the above mentioned SH, the MS will shift into a bullish one, targeting high 100s and potentially more depending on how the PA unfolds.
This "potentially more" is represented by an HTF closure above the previous ATH, targeting (in my mind) the 115/120K as main target, always trailing your positions monitoring the USDT D because, as you saw, it's the no. 1 chart to look for together with BTC.
A quick look into the MTF: we left behind another CME gap in the high 80s which is another level to monitor and that, at some point in the future, will be filled.
Once again, if it's in confluence with a key level on the USDT D chart, you can bet on it for a long/MTF spot buy.
Naturally, I want to remind you that this is not the time for buying Bitcoin for the long term, but "just" to catch some good swings to the upside and to the downside.
Filter any trap coming from ultra bullish accounts because otherwise, they will lead you to financial seppuku.
- USDT D -
And here we go with my favorite chart.
2 days ago I posted this update: https://t.co/zVPKtUfTVU
highlighting the "decent" HTF closures we had, below the 3M supply suggesting that a reversal was likely, and look what happened.
Together with the "unexpected" rise in BTC a bullish news came out, with Trump announcing a "magical strategic reserve" for crypto assets, classic story to justify a price action that was already written in the charts.
If you also paid attention to the chart I mentioned a TP1 in the 2D demand zone where we saw a perfect reaction providing both the TP and a powerful short opportunity (pump, FOMO, trap late longers).
Now it's important to notice that we closed the daily below the MTF SL at 5.01% creating a BOS and melting the LTF demand area at 4.98% (50.00% Fib) which now provides a potential retest, acting as a BB valid for pushing lower in the future.
This would also give us the 88s (or lower, CME gap), adding extra sauce to the dish.
Now for full bullishness you want to see an HTF closure below the 4.39% in order to push (ideally before a pullback) toward the M demand and the 2/3D ones in the 4.17%/4.03%.
All these areas represent at least partial TP levels to "redeem your sins" as mentioned before, always having an open mind in case this metric decides to close below
3.90% and also below 3.71%.
This would open the doors for seeing lower.
More on this: the good thing (mentioned in the last updates) is that we collected all the liquidity levels left behind in November 2024 (AMT law) and this fuel is necessary in order to push to for lower targets.
Will it happen for sure? Nobody knows.
Just adapt trailing your positions and everything will be ok, it's easier than you think when you're not deceived by the "buy more" guys.
Extra: As you can see above, we have:
- 5.66%
- 5.74%
- 5.78%
That area? Will be taken, it's not a matter of IF, but WHEN.
Pay attention to those levels and you'll likely have a good opportunity for a long/spot buy.
- TOTAL 2 -
There's a lot of work that must be done here and we're still trading in semi "no man's land", because the MS continues to generate LHs and LLs.
As you can clearly see from this chart, after taking and retesting the 1T support, we're still below the SH of the range located at 1.29T which is crucial for determining a MTF trend shift pushing into the 1.4T area.
Pay close attention if we arrive there since we have a M supply (1.38T) + a 3D supply (1.41T) therefore very strong HTF zones.
Until 1.47T is getting reclaimed, treat those levels as TPs (always look for USDT D in the meantime) not getting sucked into the "hope spiral", so manage your risk by extracting profits and also looking for calculated shorts if you're interested.
Instead, if we start losing the 1T support, the next logical areas to watch for a bounce is the 940B and the OB located in the 880B.
Loose 860B SL and altcoins become like a carcass picked clean, nothing left but bones.
Extra: If you pay attention, almost all altcoins have clean broken MSs and still presenting some signs of heaviness with juicy lower levels so again, until they take out their SHs, be careful.
As said, there's a lot of work that needs to be done, we're definitely not out of the wood so please, don't DCA blindly.
- SP500 -
I also want to add the SP500 since some of you asked me about this.
On the 4th of August I was targeting the 6.000 points: https://t.co/yDG8xf6hJI because was aligned with my 1.272 Fib extension and so far we hit this level perfectly during the last part of the 2024.
From that moment we saw a correction with a daily BOS below the mid-range (shy, but still a sign) and the last push to the upside has been completely absorbed presenting, even in this case, a shy closure.
If I watch at this MS from an analytical and rational point of view, I can see a potential distribution in the making (structure looks very similar to the BTC one) and for this reason I would pay a lot of patience with the stock market until definitive resolution.
For seeing new highs the SP500 must close with consistency above 6.150 with next target in the 6.600.
Be careful because if the distribution it's real, the weekly SL at 5.699 is the watershed that confirms it, with the SP500 heading lower.
My main target is the OB in the sub 5.500, always keeping an eye at the 2M demand at 5.000 that, at the moment, seems "fantasy" but in case of a potential "induced catastrophe", it can become reality.
This may happen with a bit of speculation revamping my "conspiracy" https://t.co/nsPTSZRh9s about the U.S debt, but it's something that must be treat with gloves and something that, even if it happens, I won't be here writing "I told you", as is just for informational purpose.
"Brother, is it possible seeing crypto outperforming with this posture on the SP500?"
Unlikely, the best situation we can experience is seeing part of the profits coming from the stock market flowing into crypto for "the last dance" since legacy investors could exploit this space for maximizing their gains, but get it out of your head that while the S&P500 is crashing, crypto can outperform it.
- Last considerations -
As the market evolves, so must your strategy.
The days of easy gains and blind optimism are fading, much like the last remnants of winter melting away under the changing season.
What once worked: holding blindly, chasing hype, relying on sheer momentum is now a relic of a different era.
Adaptability is no longer an edge; it’s the bare minimum for survival.
Liquidity shifts like the tides, narratives are rewritten overnight, and those who hesitate find themselves trapped in the jaws of volatility.
This game has never been fair, but with institutions now at the table, it has become even more ruthless.
Every pump hides a trap, every breakout tempts the impatient, and every correction shakes out those who thought they were immune to fear.
The key is discipline.
The approach of watching key levels, waiting for confirmation before acting isn’t just a method, it’s a mindset.
It keeps you detached from emotion, unshaken by noise, and focused on what actually matters.
Not believing, not hoping, not following a dream, just reacting to what the market is telling you.
The best way to play this game isn’t to stand still and hope for the best; it’s to move with intent.
Like Yoshimitsu sidestepping attacks, you have to be quick, calculated, and always ready to strike.
In and out, securing profits where they appear and cutting losses before they spiral.
Spring may bring new opportunities, but not every seed grows into a strong tree.
Some will flourish, others will wither, and the difference lies in how well you manage the risks.
The market, like nature, rewards those who adapt, those who stay sharp, and those who understand that survival isn’t about brute force, it’s about agility, patience, and knowing when to move.
As always, if you appreciated my work, the like and re-post buttons are just a few centimeters below.
- End Of January Market Update, Cooking Time/Serving the Menu - 👨🍳
Time for a complete market update freshly served as "second course" given that the first one has already been eaten: https://t.co/uN4Ec62ME9
There's a lot that must be prepared and that could be really end up in a tasty menu, so let's cook.
- TOTAL 2 -
As I recently updated, we utilized the freshly formed bearish liquidity at 1.46T/1.49T in order to push down till the bullish zones left behind during the early January uptrend located at 1.36T and 1.35T/1.33T, something I discussed in this post: https://t.co/tgrT0uPrtN
providing both partial or total TPs for all altcoins and also short opportunities.
"Naturally", this movement has been attributed to DeepSeek in order to justify it, but in reality it was already written.
Some altcoins have now fully rebalanced their late November/early December moves and purely based on R/R they represent a good buy.
Some others remain burdened with broken MS scattered throughout, making them unappealing, even with someone else’s money.
There's still plenty of work ahead, particularly with the 1.45T level acting as supply, which justifies more aggressive trimming.
More importantly, reclaiming 1.56T is crucial for confirming a strong bullish breakout.
On a broader scale, the market is still ranging without clear confirmation in either direction and the best approach at the moment is to trade within the range and avoid charts displaying obvious and unfavorable HTF MS.
What we don't want to see for ruining everything and officially declaring the "death" of altcoins is an HTF closure below 1.25T which is the WSL so monitor the major swings for having full clarity.
- USDT D -
On the 10th of January I was pointing out my partial de-risk due to some relevant levels present on the USDT D that weren't given me "strong certainties" https://t.co/Xu4fyz2OGV
highlighting the possibility of seeing the 4.27/4.28% getting hit and that's what we saw, right?
The metric taken out this level on Monday with a long wick helping us with a +1 confluence for taking some short term long opportunities.
Now 4.13% is the SH to not overtake if we don't want to see bearish continuation for the market, even because it's "supported" by the 2H HOB so definitely a level to watch for.
Ultimately, we're still ranging and that's true, but it's important to respect certain zones as breaking to the upside would also mean testing another time the BB on TOTAL 2, and given the fact that it has already been mitigated multiple times, this would contribute to weakening the zone.
You find all the details in the chart for building your strategy in a better way.
- BTC D -
Most of the bearish pressure for altcoins comes, besides of the classic PA, from the fact that the Bitcoin dominance is trending upward since early December but if we consider the whole perspective, we're still in a LH formation.
The metric is now entering inside the OTE which finds confluence with the previous high at 59.92% and where, slightly above, we have a 21H bearish liquidity level that could be served as final rejection, around the 60.10% zone.
If this happens, it's likely that ETH/BTC will complete the move highlighted here https://t.co/rN3DszFqk1
sending altcoins a little bit more down catching liquidity (toward levels that are already visible) and igniting the impulse on ETH and on altcoins as well..at least, that's my idea and a 1+1 confluence.
"Igniting the move on altcoins"..
When I suggest this scenario I don't intend what most here intend, so I'm not talking about insane multipliers with plenty of 20/50x on the table to easy catch, but rather a rebalancing of the previous moves with potential extension above the previous highs market permitting, but of course this should be played level by level and not giving it for granted.
This is due to a post I made last year and that is being assimilated and realized by people only now: https://t.co/QmRb66DhqR
However, from the current discount levels present on most charts till 3/4 of their rebalancements there are at least +100/200% and more (up to 5x).
Logically, I already know that I'm talking for the minority of market participants that, if these targets will be achieved will feel the need to raise the "threshold" targeting 10x and 20x minimum, but this is part of the market and a bloody sacrifice from many is needed.
- Final take, cooking showroom -
"So what's on the menu, Chef?"
The appetizer featured an extremely bullish January, and many of the guests had already booked their seats at the restaurant, licking their lips in anticipation but as often happens, the market cancels the reservation, leaving you empty-handed.
That being said, we must remember that Q1 isn’t over yet, we still have two more months (or perhaps less?) to ignite what could be the final phase.
We also have the Super Bowl, which historically serves as a major attraction for the masses, especially since big crypto companies use it as an opportunity for advertising.
In any case, as you know, I like to think in terms of levels rather than absolutes, and I encourage you to do the same.
Go hunting for those altcoins that still have intact structures, have fully rebalanced the impulses from late November, or are close to doing so.
They might just be your dessert to wrap up a delicious meal.
🚨 BREAKING NEWS: $USDA is officially live on #Cardano! 💵 Fully backed by USD reserves, accessible in 80+ countries with easy fiat on/off ramps. This is a massive win for the $ADA ecosystem! 🌍💰 https://t.co/dKyRkXmLoN
🎵HOSKY, the rugging meme dog,
Had a coin that’s just for fun,
And if you ever held it,
You’d know it’s worth next to none.
All of the other tokens,
Used to shout about their gains,
They never let poor HOSKY,
Play in their Ponzi games.
Then one foggy Cardano night,
Charles came to say:
“HOSKY, with your bark so true,
Won’t you help our memes break through?”
Then how the memers shouted,
“This is how it’s meant to be!”
HOSKY, the rugging meme dog,
You’ll go down in ADA history! 🎶
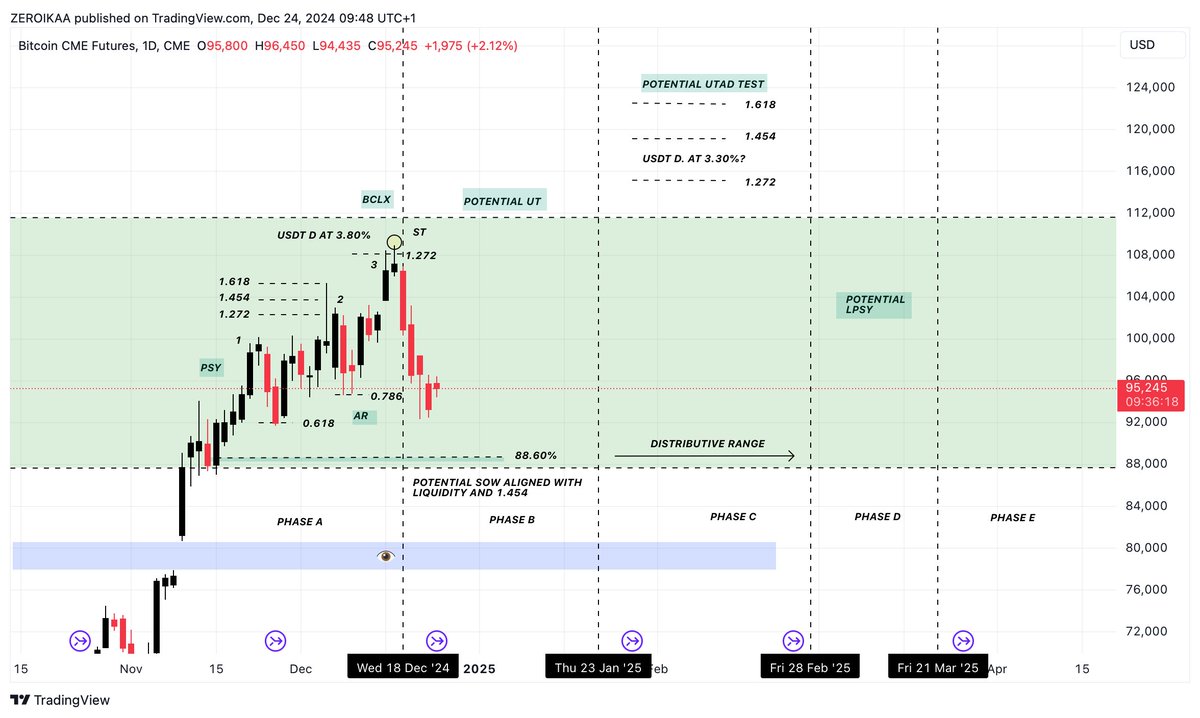
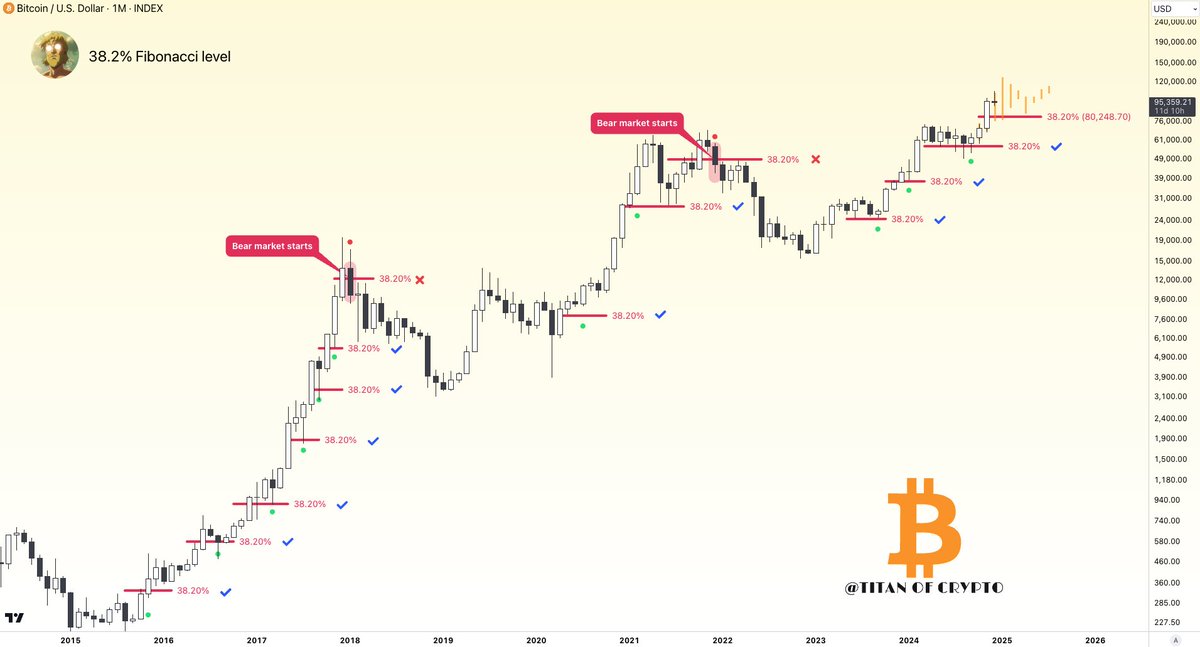
BTC1! Zoom in:
"Mate, can you show us more specifically on the chart the potential distribution?"
As you can see from this "zoomed chart", we had a perfect bearish 3 drives confirmed by the Fibonacci levels where each peak needs to retrace to the upside to the 1.272/1.454/1.618 "box" and here you can clearly see it, right?
The most interesting thing to observe is that the 3rd peak of the pattern found perfect confluence with the 3.80% key level on USDT D, providing confirmation for the pattern and perfect "exit".
The bearish 3 drives in my opinion constitutes the PHASE A of the Wyckoff distribution model.
Now we're approaching the PHASE B where we're seeing weakness and a good level to pay attention at, if provided, is approximately the 88.500$ which matches the 88.60% Fib and 1.454 of the extension and also where we have an untapped liquidity level left behind during the November impulse.
If taken, that could fuel the next impulse to the upside aka potential UT or UTAD depending the timespan and PA development.
In this case, we could see a break of the previous highs reaching the already mentioned targets at 115K/120K that perfectly align the Fibs and likely match the 3.30% on USDT D, providing a key point reference where to sell given the powerful confluences.
If this scenario plays out, the next step would imply seeing Bitcoin reaching the LPSY and if so, further confirmation of this schematic.
More context: On the 8 of November I "called" the beginning of the altseason -> https://t.co/3CJlNx7ttC and if you'll see ETH/BTC outperforming BTC in the meantime, this would confirm at almost 100% that this is a real distribution and not an accumulation.
Time to observe.
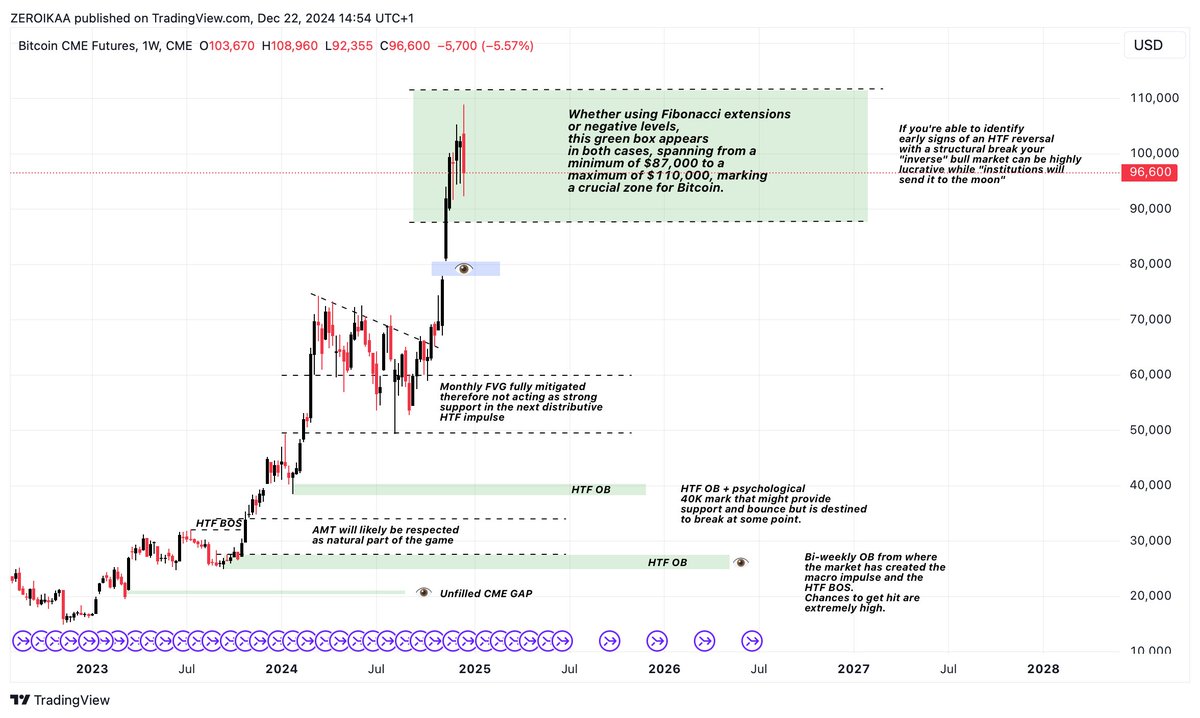
BTC1! updated and documented:
Price hit a 108.960$ high on CME, only 40$ away from the 109K level shared in August, reacting exceptionally and correcting a -15%.
It's still early to determine if this is the macro top or not, but if we switch to LTFs we can observe potential signs of distribution after a bearish 3 drives, the one that has led to the recent correction.
In the coming weeks, depending on the ability from the price to not create a macro BOS ruining the structure, we may see the formation of the UTAD typical of the classic Wyckoff distribution scheme, likely deviating above the range and sending BTC toward 115/120K.
If this happens, once at new highs, the price should stay above the resistance for days or weeks attracting a new wave of buyers convinced that BTC is primed to skyrocket.
After a series of tests, price should sink back below the prior peak heading back to the support and becoming persistently weaker, confirming the downtrend.
This scenario would imply another test of the USDT D at 3.80% that, after a proper mitigation, should not hold pushing it to the 3.30% where we have the untested multi-day OB.
This is the best outcome we can see and the one that can provide a solid exit strategy + some ideal good short setups.
Of course, once again, this is not the time to buy or hold Bitcoin but to take profits If you didn't before and monitor the situation step by step.
BREAKING: #Cardano $ADA Founder Charles Hoskinson says "Midnight will be Cardano's biggest economic event in history. It will airdrop to over 100M people and build bridges with all major networks. Midnight is an asset issued on Cardano. We will spend over $20M on integrations."
$USDT.D UPDATE
"Whales like to take profit, where they have taken profit before"
I've mentioned this several times & will continue to do so because of how important it is. I urged taking profits once March's Low was taken, because of this very reason. My bio legit says "Following the 🐳🏦", because that is how you win this game. Whales will always win, retail will always lose. The market is manipulated and designed to be this way. No, Powell's rate cuts did not cause this. It was in the charts, I warned about this months prior. To win this game, you gotta beat the whales at their own game. Find where they will sell & buy, be 2 steps ahead every time.
At this point, the majority of retail who are blind to the truth & mislead by moon-boys have gotten completely rekt or round-tripped.
Now technical wise, we have reached my first fib target (.5) and received a perfect reaction (so far). Hopefully this holds, as well as TOTAL2 closing above the 2W HOB. I'd also note usdt dominance did cause MTF bearish BOS (12H+).
- Christmas Market Update (Bloody Santa Version) 🎅🩸-
Despair, fear, sadness... not exactly the typical emotions of a classic Christmas, are they?
Time for a mega "clarification" market update freshly offered, hope you'll enjoy it. (and that will calm your nerves)
The collapse we saw was nothing but something already anticipated at the beginning of August where I shared the most interesting levels to pay attention at: https://t.co/udXCulJ5aR
While the majority of people were bull-posting at the highs because of the "ETFs" or similar stories intended to make you FOMO, I was suggesting to proceed with caution because, together with the targets shared, AMT was pending as a Damocle's sword on the market's head: https://t.co/aLTmMo75sx
I also shared something extremely interesting in my channel, a fantastic short opportunity at 108.200 where I had the confluence coming from the -0.5 & the 1.454 Fib levels, in order to provide you more "sauce": https://t.co/AN1mEHlpU8
But let's now proceed with the real dish. (Covering altcoins, you know what I think about Bitcoin overall)
- TOTAL 2 -
In the last TOTAL 2 update we were seeing the capitalization hitting a multi 20H TF HOB suggesting to pay "semi-careful" because it could have provided a rejection targeting the 1.33T where we had the multi-week supply turned into a BB: https://t.co/9NNXn1FFSD
As you can see from this updated chart, the price has taken out the level dipping at 1.22T but we didn't have any HTF closure below this zone which is the crucial and essential part.
When such key levels get hit we have 2 potential outcomes:
- They provide an immediate powerful reaction
- They continue to "melt" liquidating positions just to provide a false sense so retails panic sell their positions nourishing the necessary liquidity for pushing the prices more
And is the second option that I'm taking into consideration as long as we don't close HTF below 1.22T that would likely mean ruining the whole structure and compromising further bullish impulse.
Now in my opinion the previous HOB is no longer valid (apart from the 20H that could provide a LTF rejection -> BB) so keep your eyes open on the 1.64T and on the previous ATH at 1.71T (previous highs are always "careful levels")
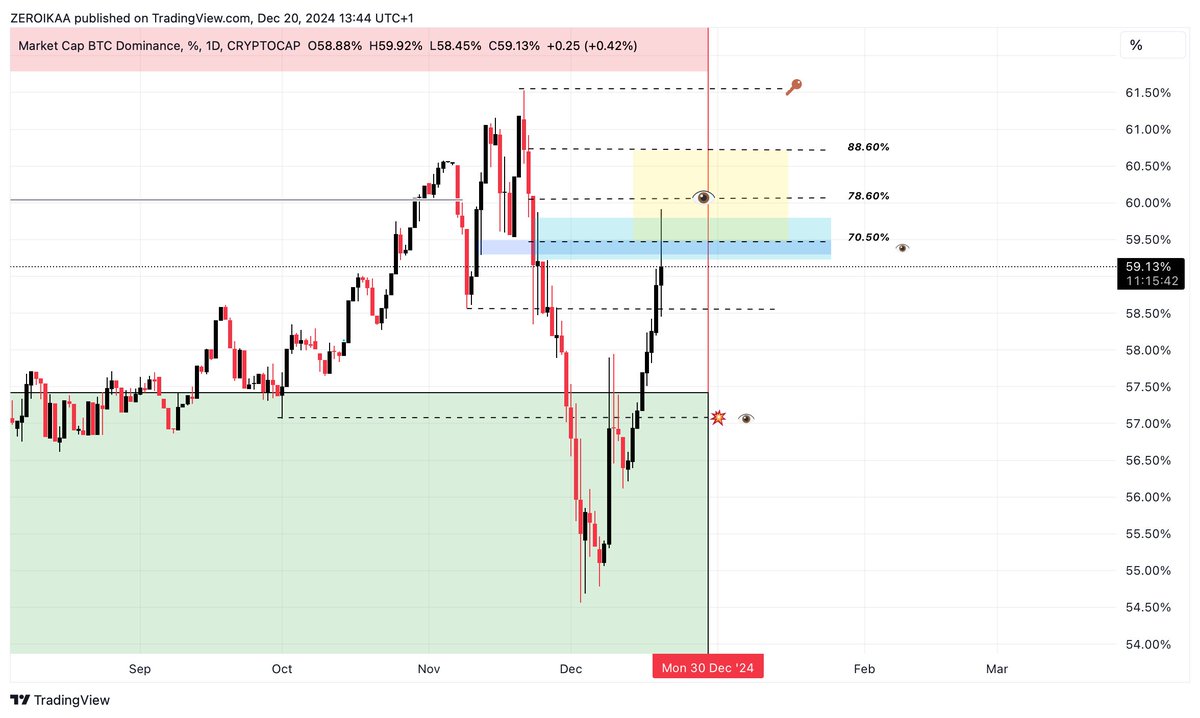
- BTC D-
Many people have been pretty much "concerned" about the last BTC D. upside, but if I watch it from an analytical standpoint, nothing has changed.
We tapped into a 3D PHOB that matches the 70.50% Fib and wicked into my favorite "retracement box" (70.50% + 78.60% + 88.60%) so technically speaking this is a bearish retest.
I would start to be concerned exclusively if we close HTF above 61.53% but this isn't my primary case given all the considerations made in the past.
It's also absolutely interesting to notice the multiple confluences provided.
When BTC D hits this level, ETH touched both HTF liquidity areas shared here: https://t.co/mlM38seGbD and also TOTAL 2 hit the BB, very curious, isn't it?
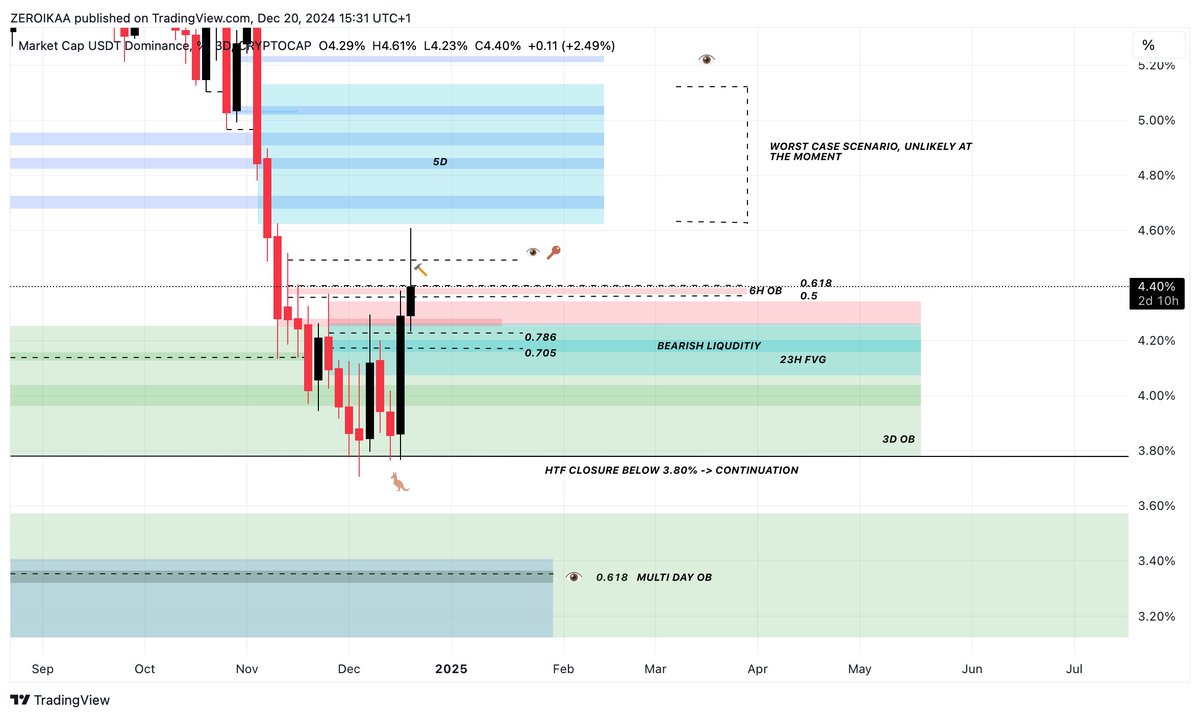
- USDT D -
Last but not least, the USDT D.
The metric has taken out the bearish liquidity at 4.20% (the one that ignited the pump till 108K) and then reversed back from 3.80%, as proof of the strength of the level.
My eyes after that touch were primarily on the 4.40% where we had that 6H OB + 0.618 & 0.5 Fib as main confluence for a potential reversal and while we have wicked above at the moment (4.61%) the important is to not close HTF above 4.52% in order to avoid a huge pick of liquidity into the 5D LB at 4.80%.
Not my main case at the moment.
Below we still have that 3.80% but we have already mitigated it multiple times contributing to make it weaker so if we will see new highs, that level will be broken, sending the USDT D at 3.30% (multi-day OB) and where we will see a powerful correction once again, likely.
- Final conclusion -
As I was bearish before, I'm trusting my plan and I'm accumulating + opening some longs on interesting altcoins that have reached their HTF liquidity levels.
To me, this is a shakeout in order to absorb the necessary liquidity before another push and I will treat it as such until proven otherwise.
Of course, I don't have the crystal ball and I will always re-adjust if something changes, but as posted yesterday, Kendrick Lamar might be right saying: "Now or Never".
Oh, and if you like my posts don't forget to press the repost and like buttons, they mean a lot for supporting my work.
Happy "Bloody Christmas" by SM.
Happy "Shopping" if you trust your plan.
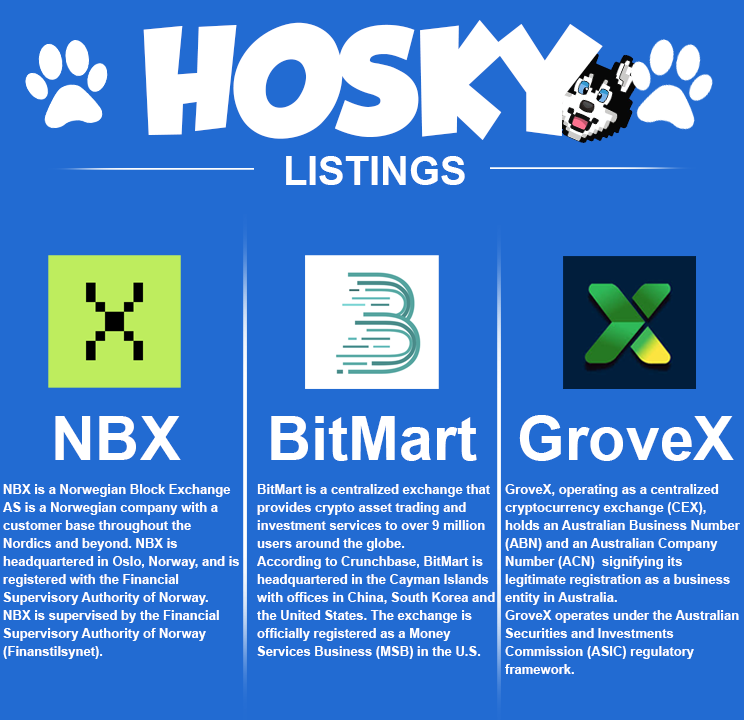
🚨 BIG NEWS 🚨
In just 2 weeks, @hoskytoken has announced listings on 3 centralized exchanges:
🐾 @nbxcom 🇳🇴
🐾 @BitMartExchange 🌎
🐾 @GroveXchange 🇦🇺
The top dog is making moves—stay tuned! 🐶💥
$HOSKY