This is amazing.
The White House waived Jones Act requirements in mid-March, and it's generated billions in economic activity and revealed tons of natural trade routes that were impossible while the Act was in effect.
We really need to permanently remove this stupid law!
Teaching my oldest son about taxes
Tell him he owes me 20% of his "adjusted allowance"
He asks what "adjusted" means
Hand him a "publication 17" I made up
He asks which deductions apply to him
Tell him to read "section 4" (there is no section 4, it's been superseded by 5(1)(a))
He comes back asking if his Pokemon card collection is depreciable
I say "maybe" if he trades any for gain
What's "gain" he says
He asks if he can just give me his whole allowance instead
He says "that would be easier"
I say "we don't tax 100%. this isn't New York"
He asks what that means
I hand him "Form 18" and tell him he has to choose how he wants to be taxed
"but be careful because the wrong choice could double your tax rate to 40%"
He says "this is insane"
I say "no son, this is optimizing"
He asks what optimizing means
He asks if other kids have to do this
He says "this is dumb, if you know how much I owe why wouldn't you just tell me"
He understands tax now
I've never been more proud
I ran more numbers.
When you adjust by number of illegal aliens, Minneapolis becomes #1, with 3x more violent confrontations than #2 Portland.
And 114x more than the average of all counties outside the top 8.
Minneapolis is America's hotbed of violent confrontation with ICE.
Very misleading from Walz. Yes, his prisons honor ICE detainers by transferring *convicted* criminal aliens after they serve their sentence, but his city and county jails do not.
ICE wants criminal aliens arrested for crimes handed to them instead of being released to streets.
Even California prisons honor ICE detainers.
The sanctuary fights are over city and county jails.
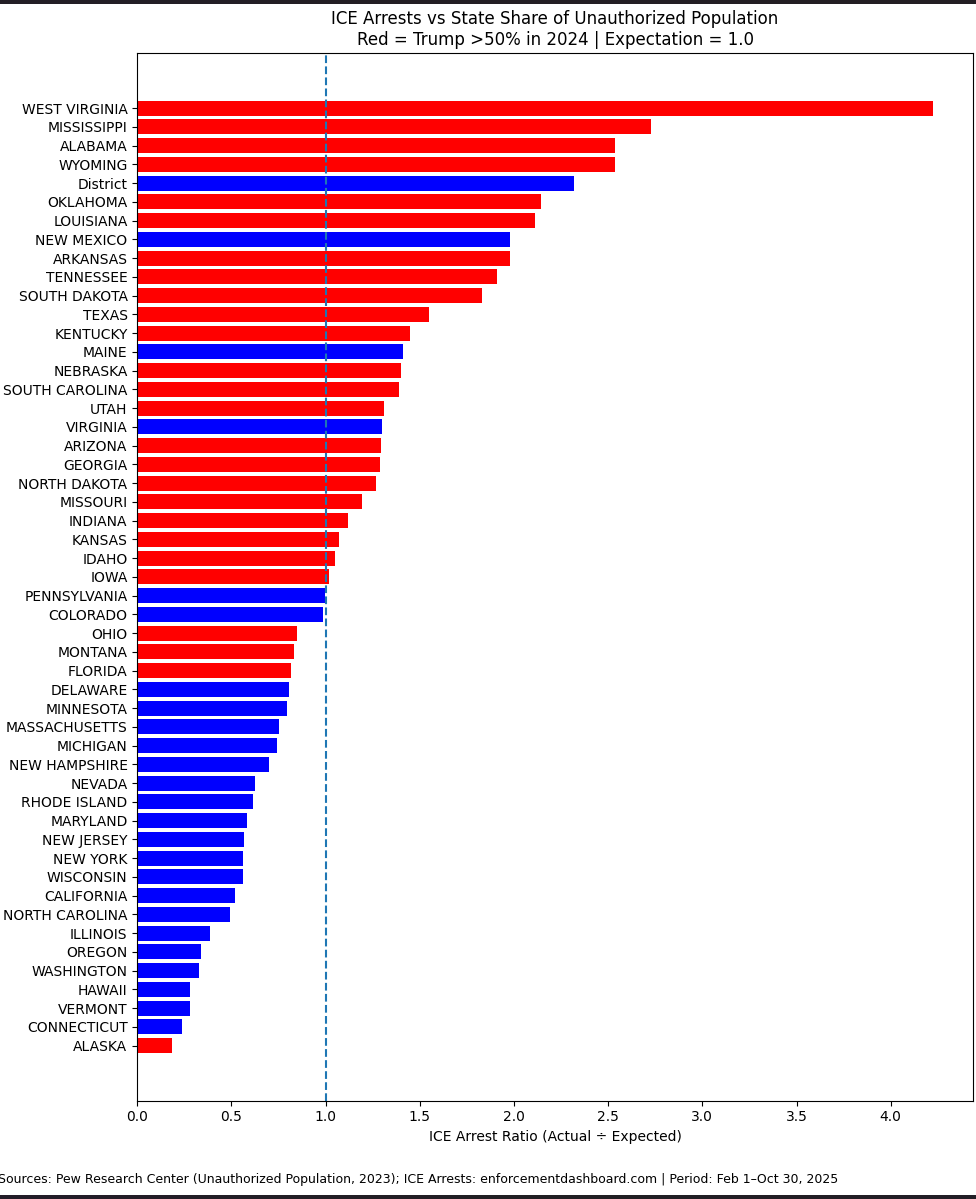
Trump isn't targeting blue states. They just gum up the works, so require more ICE presence.
From Feb–Oct 2025, red states disproportionately more ICE arrests relative to their illegal migrant population share. Large blue states like California, New York, and Illinois fell well below expectation.
Note: DC is federally controlled.
@RyanGirdusky
One of the great ironies of the "woke" era is that in many places where the "antiracist" left is in charge of education, black students do worse, and in many former slave states, they do better.
US debt issuances are skyrocketing:
In 2024, over 50% of all credit assets coming to the market were in US Treasuries.
The US Treasury issued $1.7 trillion in debt last year, more than double the $800 billion issued by companies in the corporate bond market.
By comparison, the value of total mortgages and municipal securities issued was $600 billion and $100 billion, respectively.
To put this differently, investors are now allocating more of their capital to finance US government than loans to firms and consumers.
The deficit crisis is worse than ever before.
🚨NEW Ohio school voucher study:
“Voucher students were substantially more likely to enroll in college than students who remained in public schools (64 versus 48 percent). The differences in college enrollment were especially large at four-year colleges (45 versus 30 percent) and selective colleges (29 versus 19 percent). The enrollment impacts were strongest for male students, Black students, students with below-median test scores before leaving public school, and students from the lowest-income families.”
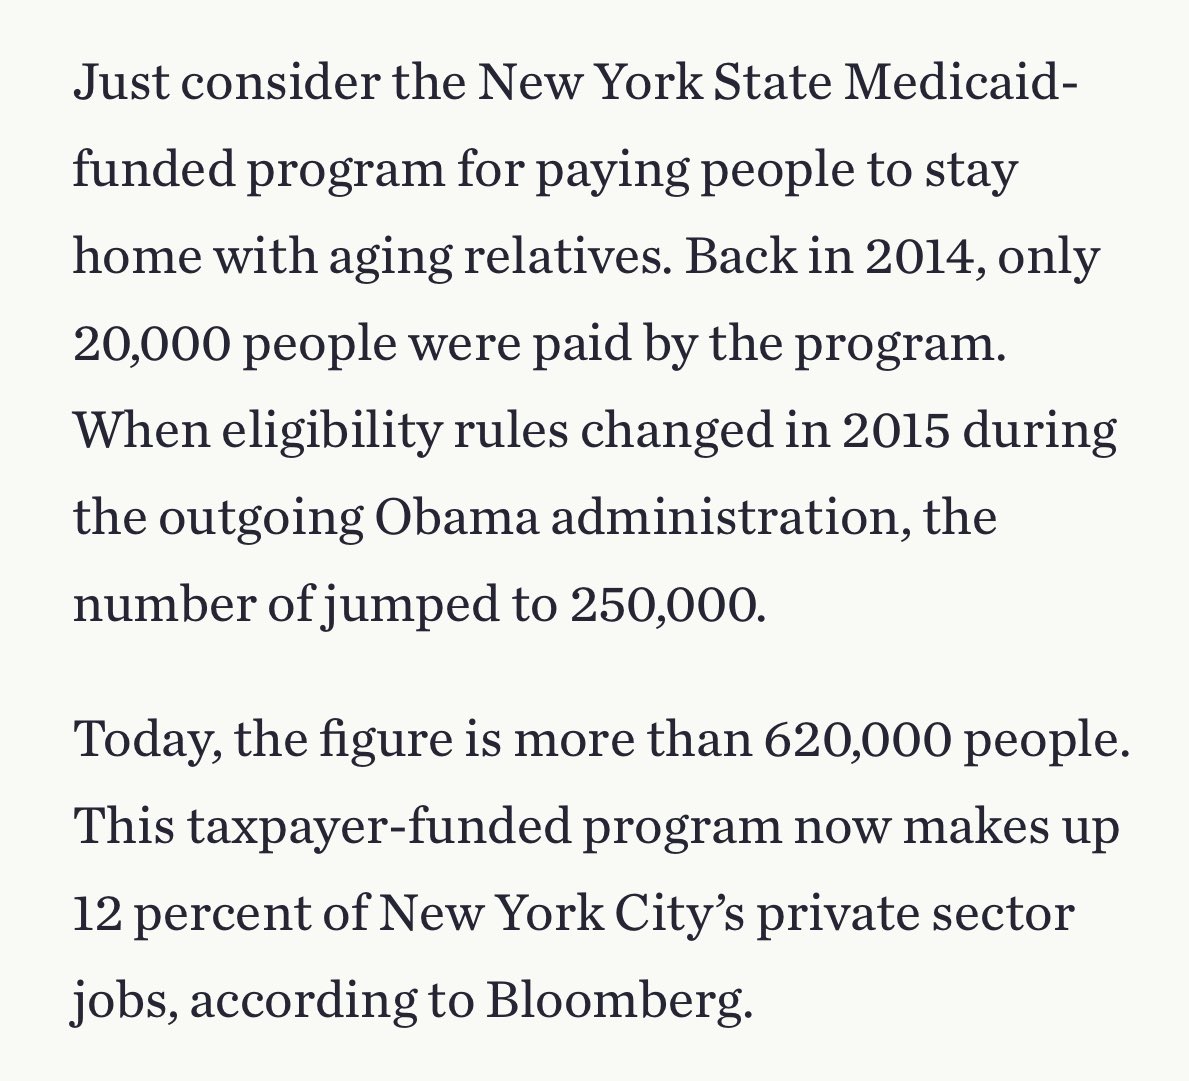
I’ve talked about this before. It’s astounding when you look at the numbers. Medicaid paying people to stay at home to take care of relatives accounts for 12% of all jobs in NYC!
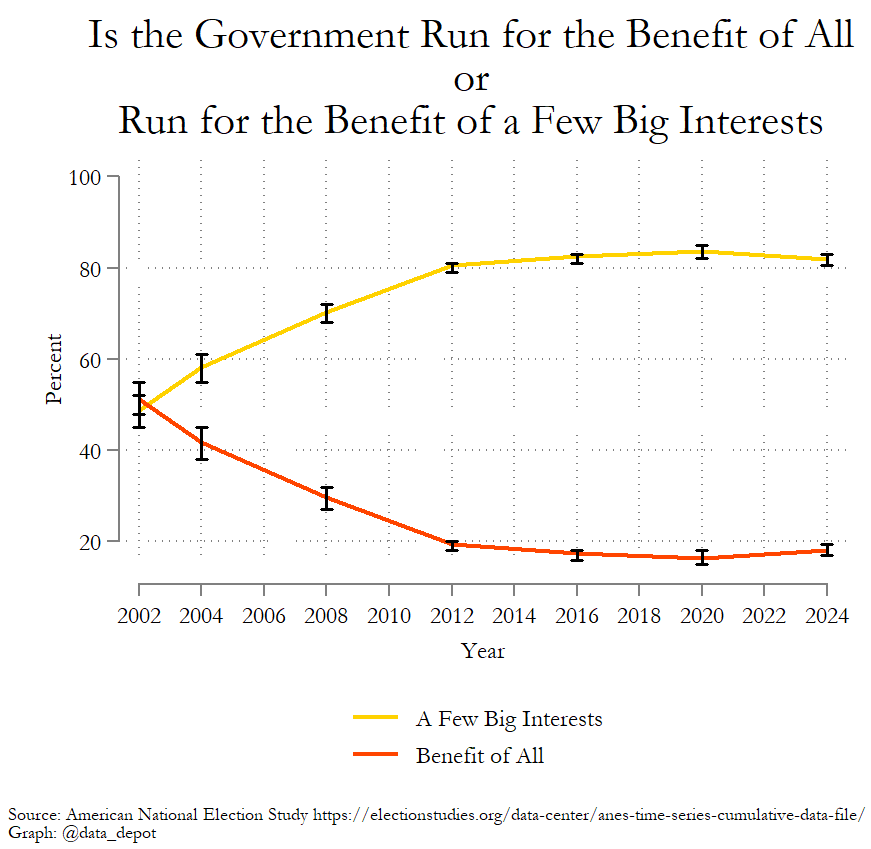
In 2002, 48% of Americans said "the govt is run by a few big interests looking out for themselves." 52% said "it is run for the benefit of all people."
In 2024, 82% said the govt is run by a few big interests. Only 17% said it is run for the benefit of all people.
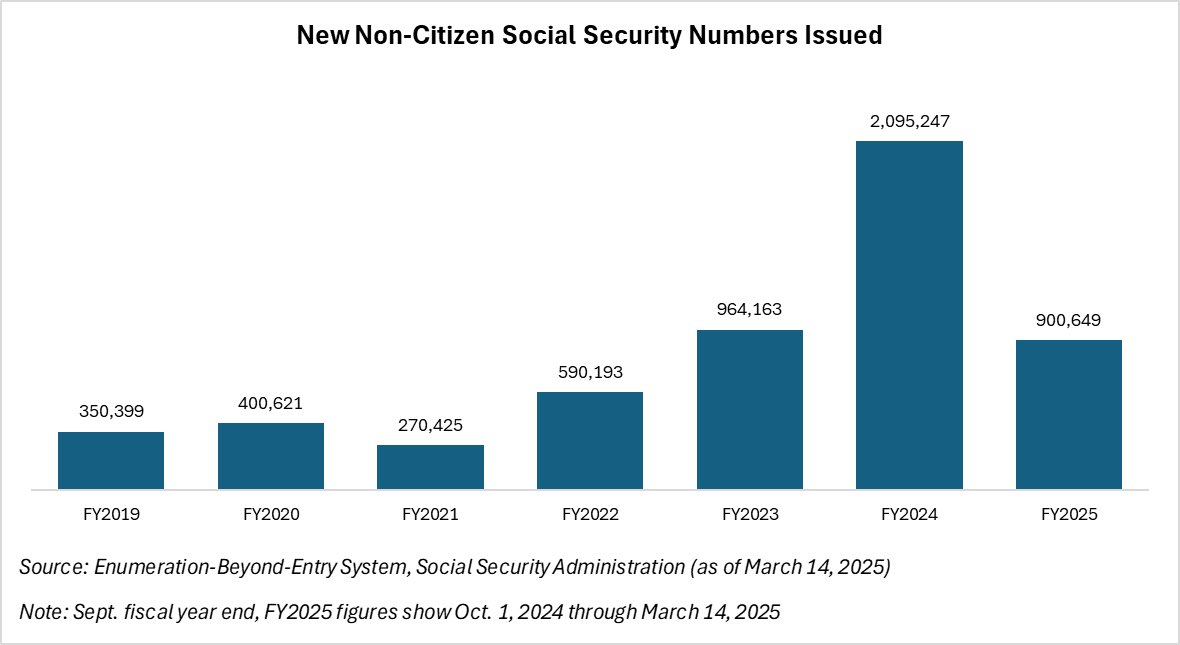
Your data is apples to oranges. The data you show for the 2016 to 2020 period is enumeration for all immigrants in ALL forms. The data we showed in our slide last night in Wisconsin was just Enumeration Beyond Entry ("EBE") immigrants. The difference is Enumerations at Field Offices. These have remained stable at about 1 mln/year excluding COVID. We focused just on EBE because it ramped as a direct result of growth in the various asylum programs.
Your chart mixes the two categories: showing all immigrant Enumerations from 2016 thru 2020 and EBE only from 2021 to 2024.
Here is the chart back to 2019 for Enumeration Beyond Entry which is when the EBE basically started.
I want to thank the good people at the Social Security Administration for their expert help. We would not have been able to understand this complex system without them. There are many terrific people at SSA serving their fellow citizens. We are very grateful.
I believe these facts speak for themselves. As the son of legal immigrants to America, I am an ardent supporter of legal immigration.
Teachers make up 47% of K12 education staff, and that percentage is declining year after year
They’re less than half of staff! In what world does this make sense?!
My gosh. Fire the bureaucrats and give the best teachers a heaping raise